
|
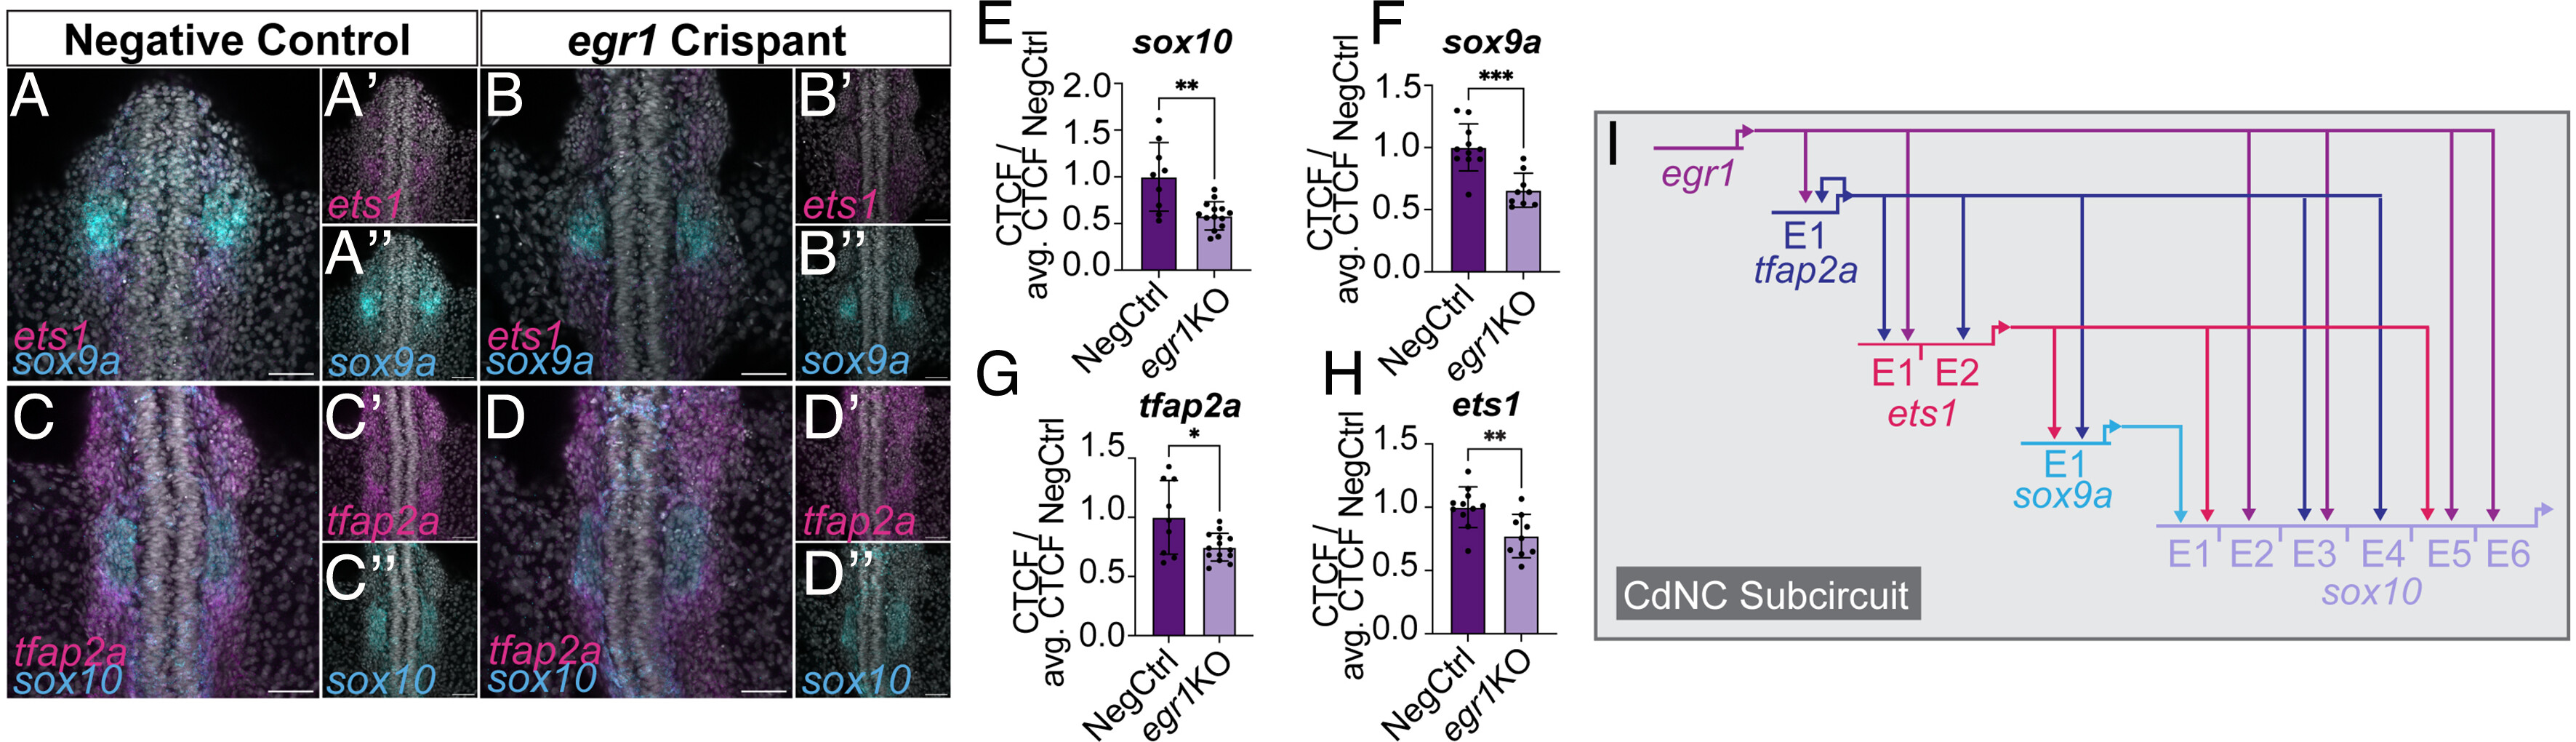
Fig. 3 Loss of egr1 leads to a downregulation of CdNC genes and suggests an important role as core CdNC subcircuit transcription factor. HCR staining for ets1 and sox9a in 16ss zebrafish embryos injected with negative control gRNA (n = 11) (A and A”) and egr1 gRNA (n = 9) (B and B”). HCR staining for tfap2a and sox10 in 16ss zebrafish embryos injected with negative control gRNA (n = 9) (C and C″) and egr1 gRNA (n = 14) (D and D”). (E–H) Quantification of CTCF in negative control and egr1 gRNA injected embryos (unpaired Student’s t test P < 0.05). (I) Migratory CdNC subcircuit displaying proposed interactions between shown transcription factors and downstream enhancer regions. (Scale bar, 50 μm.)