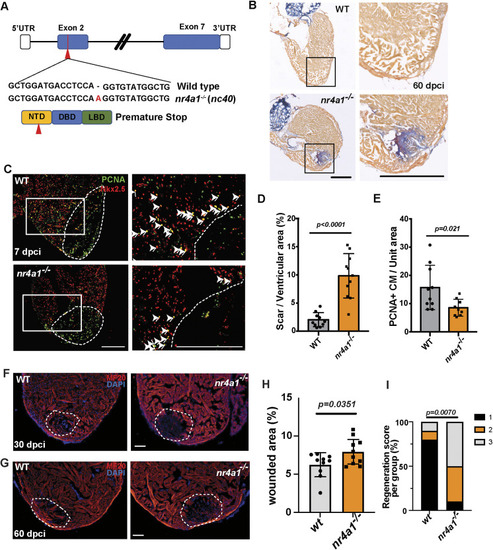
Impaired cardiac regeneration in nr4a1 mutants. (A) Diagram depicting the generation of nr4a1 mutants, illustrating the mutations at both the genome and protein levels. (B) AFOG staining performed on wild-type (WT) and nr4a1 mutant samples at 60 dpci. Boxed regions show the position of magnified images on the right. (C) PCNA/Nkx2.5 double immunostaining to detect proliferating cardiomyocytes at 7 dpci on WT and nr4a1 mutant cardiac sections. Arrowheads indicate the proliferating cardiomyocytes. Boxed regions show the approximate positions for quantification. (D) Quantification of scar area based on AFOG staining. (E) Quantification of colocalization between PCNA and Nkx2.5 per unit area for both WT and nr4a1 mutant samples. (F,H) Section images of WT or nr4a1 mutant ventricles at 30 dpci assessed for muscle recovery (F) and quantification of injured area (H). (G,I) Myocardial regeneration was measured at 60 dpci in WT and nr4a1 mutants, respectively. Ten individual samples in each group were examined. Myocardial regeneration is categorized as follows: 1, complete regeneration of a new myocardial wall; 2, partial regeneration; and 3, a strong block in regeneration. Dashed lines (C,F,G) show the wounded area. P-values<0.05 were considered statistically significant (two-tailed unpaired t-test, D,E,H; Chi-squared test, I). Points in D, E and H show the individual samples. Data are mean±s.e.m. Scale bars: 275 µm (B); 250 µm (C); 100 µm (F,G).
|
