FIGURE SUMMARY
Title

Nr4a1 modulates inflammation and heart regeneration in zebrafish

Authors
Feng, D., Dong, Y., Song, Y., Yapundich, N., Xie, Y., Spurlock, B., Lyu, T., Kuehn, L., Qian, L., Liu, J.
Source
Full text @ Development

Dynamic expression of Nr4a1 after cardiac injury. (A) Expression pattern of nr4a1 at different stages post-injury. The fold change is calculated relative to the expression in uninjured wild-type (wt) hearts. (B) The schematic for generating TgKI(nr4a1:eGFP). (C) Detection of nr4a1:eGFP fusion mRNA. The 518 bp band indicates correct nr4a1:eGFP fusion cDNA. (D) Western blot analysis of TgKI(nr4a1:eGFP) to identify the fusion Nr4a1:eGPF protein (88kD). (E-H) Expression of Nr4a1, as revealed by GFP antibody staining, in 2 and 7 dpci hearts. (I) IB4 staining to localize Nr4a1 expression in macrophages within 7 dpci hearts. (J) Anti-Mpx antibody staining to localize Nr4a1 expression in neutrophils within 2 dpci hearts. P-values<0.05 were considered statistically significant (two-tailed unpaired t-test). Scale bars: 60 µm.

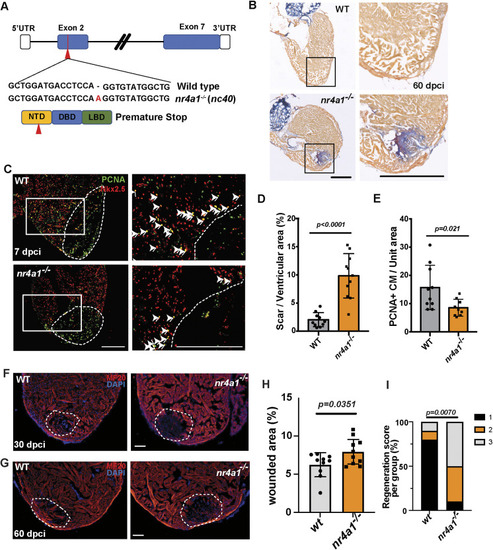
Impaired cardiac regeneration in nr4a1 mutants. (A) Diagram depicting the generation of nr4a1 mutants, illustrating the mutations at both the genome and protein levels. (B) AFOG staining performed on wild-type (WT) and nr4a1 mutant samples at 60 dpci. Boxed regions show the position of magnified images on the right. (C) PCNA/Nkx2.5 double immunostaining to detect proliferating cardiomyocytes at 7 dpci on WT and nr4a1 mutant cardiac sections. Arrowheads indicate the proliferating cardiomyocytes. Boxed regions show the approximate positions for quantification. (D) Quantification of scar area based on AFOG staining. (E) Quantification of colocalization between PCNA and Nkx2.5 per unit area for both WT and nr4a1 mutant samples. (F,H) Section images of WT or nr4a1 mutant ventricles at 30 dpci assessed for muscle recovery (F) and quantification of injured area (H). (G,I) Myocardial regeneration was measured at 60 dpci in WT and nr4a1 mutants, respectively. Ten individual samples in each group were examined. Myocardial regeneration is categorized as follows: 1, complete regeneration of a new myocardial wall; 2, partial regeneration; and 3, a strong block in regeneration. Dashed lines (C,F,G) show the wounded area. P-values<0.05 were considered statistically significant (two-tailed unpaired t-test, D,E,H; Chi-squared test, I). Points in D, E and H show the individual samples. Data are mean±s.e.m. Scale bars: 275 µm (B); 250 µm (C); 100 µm (F,G).

Defective neutrophil migration in nr4a1 mutant. (A-F) Left: distribution of neutrophils in uninjured wild-type (WT) hearts and WT hearts at 6 hpci and 1, 2,7, and 14 dpci. Right: distribution of neutrophils in uninjured nr4a1 mutant hearts and nr4a1 mutant hearts at 6 hpci and 1, 2,7, and 14 dpci. Boxed regions show the approximate positions for cell number quantification, and position of magnified images. Dashed box regions show the approximate positions of neutrophils around the wounded area. (G) Temporal dynamics of neutrophil number across multiple time points. Individual sample numbers (n) are indicated on the plot. (H,I) Percentage of neutrophil numbers in the wounded area per unit square area. (J) Schematic depicting the temporal dynamics of neutrophil number during heart regeneration. Created in BioRender by Feng, D., 2025. https://BioRender.com/vyhyvzk. This figure was sublicensed under CC-BY 4.0 terms. P-values<0.05 were considered statistically significant (two-tailed unpaired t-test, G). Data are mean±s.e.m. Scale bars: 275 µm.

Abnormal accumulation of inflammatory macrophages in nr4a1 mutant. (A-C) Left: distribution of inflammatory macrophages in uninjured wild-type (WT) hearts and WT hearts at 7 and 14 dpci. Right: distribution of inflammatory macrophages in uninjured nr4a1 mutant hearts and nr4a1 mutant hearts at 7 and 14 dpci. Boxed regions in A-C show the approximate positions for quantification, and position of magnified images. Dashed lines show the wounded area. (D,E) Quantification of inflammatory macrophages in the unit area at 7 and 14 dpci. (F-H) qPCR results of inflammation-related genes tnfa, mpeg1.1 and acod1. All fold changes are calculated relative to the uninjured WT group in each panel. (I) Schematic showing inflammatory macrophage distribution in WT and nr4a1 mutant. Created in BioRender by Feng, D., 2025. https://BioRender.com/ynn17bt. This figure was sublicensed under CC-BY 4.0 terms. P-values<0.05 were considered statistically significant (two-tailed unpaired t-test, D,E; two-way ANOVA with Sidak test for multiple comparison correction and two-tailed unpaired t-test, F-H). Points in D and E show the individual samples. Data are mean±s.e.m. Scale bars: 275 µm.

Persistent fibrosis in nr4a1 mutant after cardiac injury. (A-C) Left: distribution of fibroblasts on cardiac sections of uninjured wild-type (WT) hearts or WT hearts at 21 and 30 dpci. Right: distribution of fibroblasts on cardiac sections of uninjured nr4a1 mutant hearts or nr4a1 mutant hearts at 21 and 30 dpci. (D,E) Quantification of fibroblasts per unit area for WT and nr4a1 mutant hearts at 21 and 30 dpci. (F,H) Collagen deposition, as revealed by collagen I antibody staining, in WT and nr4a1 mutant at 21 dpci and 30 dpci, respectively. (G,I) Quantification of collagen deposition in the wounded area of WT and nr4a1 mutant hearts at 21 dpci and 30 dpci, respectively. (J,L) α-SMA immunostaining at 30 dpci and 60 dpci injured hearts, respectively. Left: WT group; Right: nr4a1 mutant group. (K,M) Quantification of α-SMA signal in the wounded area at 30 dpci and 60 dpci, respectively. (N) Schematic showing persistent fibrosis in nr4a1 mutant. Dashed lines show the wounded area. Boxed regions show the approximate positions for quantification, and position of magnified images. Created in BioRender by Feng, D., 2025. https://BioRender.com/ok17j9e. This figure was sublicensed under CC-BY 4.0 terms. P-values<0.05 were considered statistically significant (two-way ANOVA with Sidak test for multiple comparison correction and two-tailed unpaired t-test). Points in D, E, G, I, K and M show the individual samples. Data are mean±s.e.m. Scale bars: 275 µm.

Upregulation of inflammation-, fibrosis- and apoptosis-related genes in nr4a1 mutant revealed by transcriptomic analysis. (A) Principal component analysis (PCA) plots represent the gene expression in hearts at different time points. (B,C) Venn diagrams of the upregulated (B) or downregulated (C) differentially expressed genes (DEGs) between control and mutant hearts from different stages after cryoinjury. (D) Volcano plots showing the DEGs at different stages after injury. Some representative genes are marked. Orange dots: upregulated DEGs in nr4a1 mutant; green dots: downregulated DEGs in nr4a1 mutant; log2 fold change ≥0.5; adjusted P-value<0.05. Color intensity represents the density of points in the volcano plot. (E) Hierarchical clustering heatmap of the comparatively DEGs in control and nr4a1 mutant hearts. A total of 12 clusters were generated, and cluster-enriched genes involved in their predicted GO biological processes were listed in the right panels. (F) Gene set enrichment analysis (GSEA) plots of DEGs encoding cytokine-cytokine receptor interaction linked with ablation of nr4a1 at 21 dpci. (G) GSEA plots of DEGs encoding ECM linked with deletion of nr4a1. The barcode plot indicates the positions of genes ranked by relevance, with red and blue colors denoting upregulation or downregulation, respectively, in the mutant fish hearts.

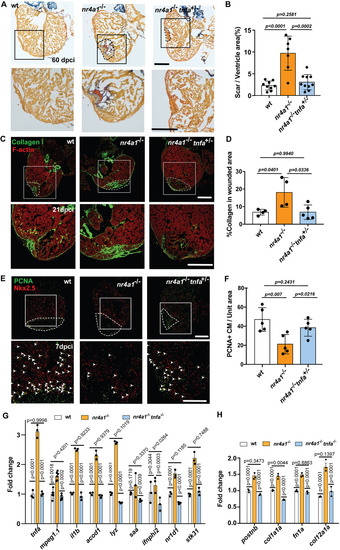
Partial restoration of cardiac regeneration in nr4a1 mutant through reduction of inflammatory response. (A) AFOG staining performed on cardiac sections of the indicated genotypes at 60 dpci. (B) Quantification of scar size in AFOG-stained cardiac sections. (C) Collagen deposition in the hearts of indicated genotypes at 21 dpci, as detected by staining with collagen I antibody. (D) Quantification of collagen deposition in the wounded area at 21 dpci. (E) PCNA/Nkx2.5 double immunostaining to detect proliferating cardiomyocytes in 7 dpci hearts of indicated genotypes. Arrowheads indicate the proliferating cardiomyocytes. (F) Quantification of colocalization of PCNA and Nkx2.5 per unit area in different groups. (G) qPCR of inflammation-related genes in the hearts of indicated genotypes at 7 dpci. (H) qPCR of fibrosis-related genes in the hearts of indicated genotypes at 7 dpci. Dashed lines show the wounded area. Boxed regions in A and E show the position of magnified images at the bottom. Boxed regions in C show the approximate positions for quantification. The fold changes in G and H are calculated relative to the expression in uninjured WT hearts. P-values<0.05 were considered to be statistically significant (two-tailed unpaired t-test in B, D and F; two-way ANOVA with Sidak test for multiple comparison correction and two-tailed unpaired t-test in G and H). Data are mean±s.e.m. Scale bars: 275 µm (A,E); 250 µm (C).

Acknowledgments
This image is the copyrighted work of the attributed author or publisher, and ZFIN has permission only to display this image to its users. Additional permissions should be obtained from the applicable author or publisher of the image. Full text @ Development