FIGURE

FIGURE 4

ID
ZDB-FIG-250501-57
Publication
Konar et al., 2025 - Analysis of the senescence secretome during zebrafish retina regeneration
Other Figures
All Figure Page
Back to All Figure Page
FIGURE 4

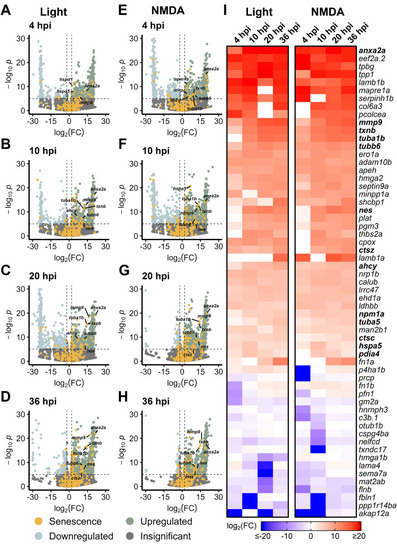
Upregulation of SASP factors in Müller glia after light and NMDA damage. Bulk RNAseq was performed on gfap+ Müller glia after either NMDA or light damage compared to undamaged controls. (A–D) Volcano plots showing differentially expressed SASP factors at the indicated times post light damage. (E–H) Volcano plots showing differentially expressed SASP factors at the indicated times post NMDA damage. Dashed lines represent values with a |log2FC| > 2 and p-values <10−6. Top significantly upregulated factors are labeled for each time point. (I) Heatmap showing enrichment of SASP factors at the indicated times post light or NMDA damage. SASP factors were included in the heatmap if they had a log2FC > 5 with p-values <10−6 for at least one time point; bolded genes are part of overlapping set of SRRFs.

Expression Data

Expression Detail
Antibody Labeling
Phenotype Data

Phenotype Detail
Acknowledgments
This image is the copyrighted work of the attributed author or publisher, and ZFIN has permission only to display this image to its users. Additional permissions should be obtained from the applicable author or publisher of the image. Full text @ Front Aging