
FIGURE
Fig. 4
Fig. 4
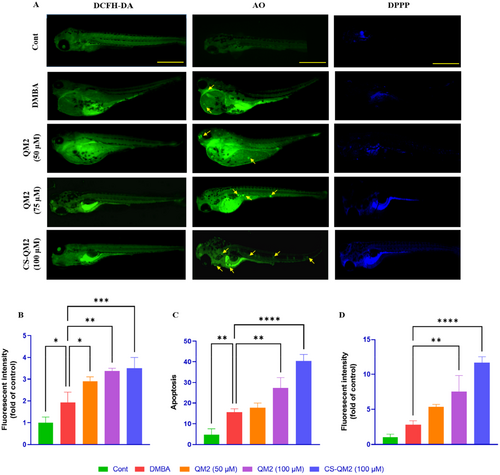
Fluorescent photomicrograph and relative fluorescent intensities of zebrafish larvae. (A) Fluorescent photomicrograph of zebrafish larvae; (B) Analysis of intracellular ROS levels using DCFH-DA stain to estimate oxidative stress; (C) Quantification of apoptosis using AO stain to identify cell death; (D) Quantifying cellular damage by visualizing LPO using DPPP stain. Data are presented as mean ± standard deviation of replicates. The asterix represents the statistical significance compared to the DMBA group. The yellow arrow indicates apoptosis; scale bar: 400 µm. |
Expression Data
Expression Detail
Antibody Labeling
Phenotype Data
Phenotype Detail
Acknowledgments
This image is the copyrighted work of the attributed author or publisher, and
ZFIN has permission only to display this image to its users.
Additional permissions should be obtained from the applicable author or publisher of the image.
Full text @ J. Biochem. Mol. Toxicol.