
FIGURE
Fig. 8
Fig. 8
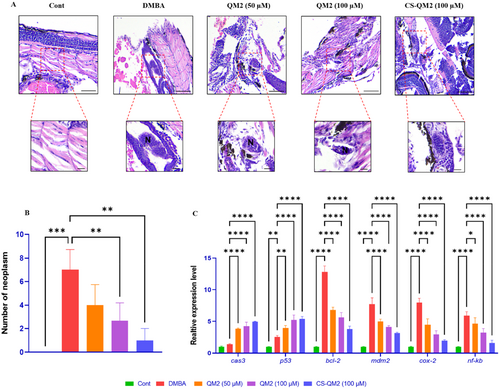
Representation of the neoplasm growth and gene expression analysis in zebrafish larvae. (A) Photomicrograph of a histological section of zebrafish larvae stained with H&E. Statistical representation of (B) neoplasm quantity and (C) relative gene expression in zebrafish larvae. Data are presented as mean ± standard deviation of replicates. The asterix represents the statistical significance compared to the DMBA group. N – Neoplasm growth; Scale bar: 50 µm and 20 µm. |
Expression Data
Expression Detail
Antibody Labeling
Phenotype Data
Phenotype Detail
Acknowledgments
This image is the copyrighted work of the attributed author or publisher, and
ZFIN has permission only to display this image to its users.
Additional permissions should be obtained from the applicable author or publisher of the image.
Full text @ J. Biochem. Mol. Toxicol.