
- Title
-
Nano-Encapsulated Coumarin Derivative, CS-QM2 Inhibits Neoplasm Growth: Experimented in Zebrafish Model
- Authors
- Madesh, S., Murugan, R., Sau, A., Jubie, S., Swaroop, A.K., Rajagopal, R., Kumaradoss, K.M., Arockiaraj, J.
- Source
- Full text @ J. Biochem. Mol. Toxicol.
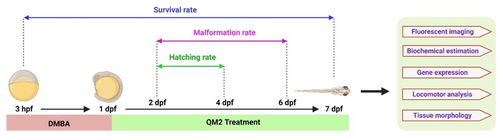
Experimental paradigm of QM2 treatment on DMBA induce neoplasm in zebrafish larvae. |
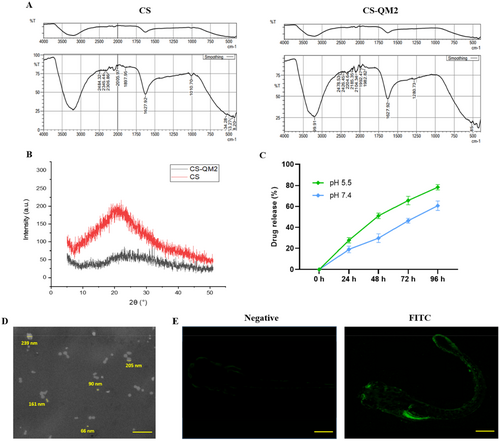
Characterization of CS-QM2 nanoparticle and its distribution in zebrafish larvae. (A) FTIR spectra of CS and CS-QM2 nanoparticles. (B) XRD patterns for CS and CS-QM2 nanoparticle. (C) Drug release efficiency of CS conjugate under acidic and physiological conditions. (D) SEM analysis of CS-QM2 nanoparticles produced by ionotropic gelation; scale bar: 1 µm (E) Distribution of FITC tagged CS-QM2 nanoparticle in zebrafish larvae; scale bar: 350 µm. |
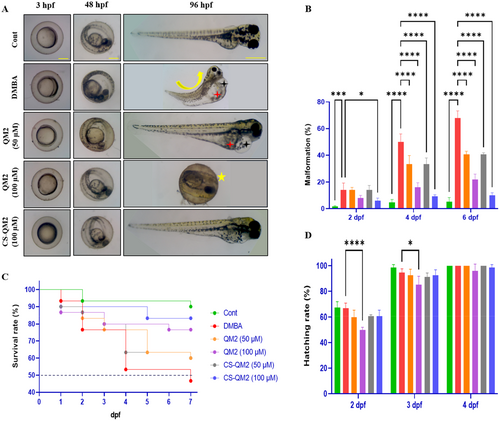
Effect of the QM2 compound and CS-QM2 nanoparticle on the DMBA induced malformations in zebrafish larvae. (A) Photomicrograph of developmental analysis on eleuthero embryos for 96 h. (B) Quantitative analysis of malformation rate. (C) Kaplan-Myers graph of zebrafish embryo survivability assay. (D) Hatching rate of zebrafish embryo. Data are presented as mean ± standard deviation of replicates. The asterix represents the statistical significance compared to the DMBA group. Black star – pericardial edema; Curve line – scoliosis; Red star – yolk sac edema; Yellow star – delayed hatching. Scale bar: 100 µm and 400 µm. |
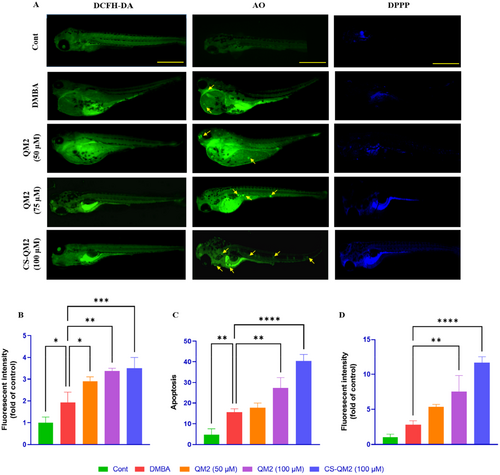
Fluorescent photomicrograph and relative fluorescent intensities of zebrafish larvae. (A) Fluorescent photomicrograph of zebrafish larvae; (B) Analysis of intracellular ROS levels using DCFH-DA stain to estimate oxidative stress; (C) Quantification of apoptosis using AO stain to identify cell death; (D) Quantifying cellular damage by visualizing LPO using DPPP stain. Data are presented as mean ± standard deviation of replicates. The asterix represents the statistical significance compared to the DMBA group. The yellow arrow indicates apoptosis; scale bar: 400 µm. |
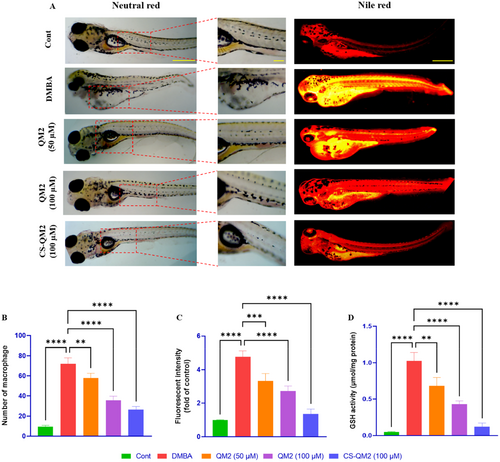
Representation of the macrophage accumulation and fluorescent photomicrograph of zebrafish larvae. (A) Visualization of macrophage accumulation and neutral lipid droplets in zebrafish larvae using neutral red stain and nile red stain. (B) Statistical representation of macrophage accumulations; (C) Statistical representation of relative fluorescent intensity (fold of control) of zebrafish larvae. (D) Estimation of GSH activity in zebrafish larvae. Data are presented as mean ± standard deviation of replicates. The asterix represents the statistical significance compared to the DMBA group. Scale bar: 400 µm and 100 µm. |
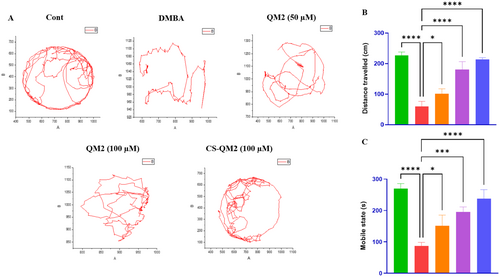
Representation of the locomotion behavior of zebrafish larvae. (A) Free swimming trajectory locomotion analysis of zebrafish larvae for 5 min; Statistical representation of (B) total distance covered by larvae and (C) mobile state of larvae. Data are presented as mean ± standard deviation of replicates. The asterix represents the statistical significance compared to the DMBA group. |
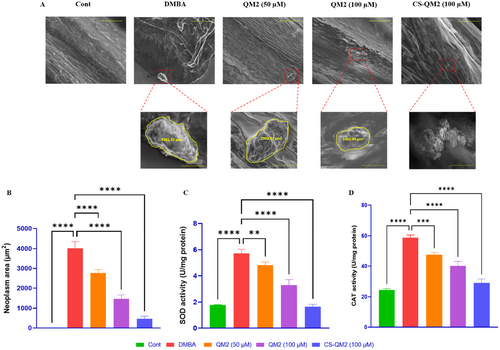
Representation of the morphological analysis and biochemical markers in zebrafish larvae. (A) SEM analysis of neoplasm occurrence in zebrafish larvae. Statistical representation of (B) neoplasm area, (C) SOD level, and (D) CAT level in zebrafish larvae. Data are presented as mean ± standard deviation of replicates. The asterix represents the statistical significance compared to the DMBA group. Scale bar: 50 µm and 10 µm. |
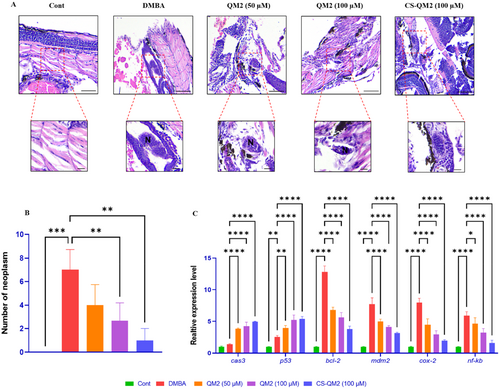
Representation of the neoplasm growth and gene expression analysis in zebrafish larvae. (A) Photomicrograph of a histological section of zebrafish larvae stained with H&E. Statistical representation of (B) neoplasm quantity and (C) relative gene expression in zebrafish larvae. Data are presented as mean ± standard deviation of replicates. The asterix represents the statistical significance compared to the DMBA group. N – Neoplasm growth; Scale bar: 50 µm and 20 µm. |
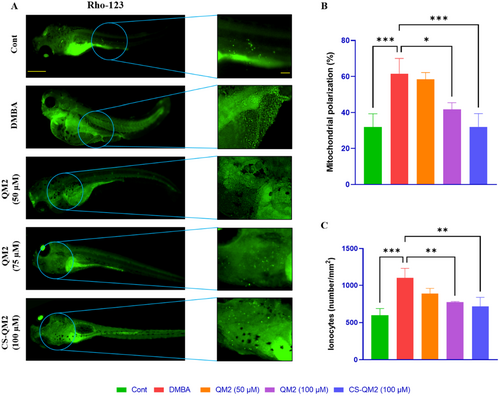
Representation of the mitochondrial membrane potential of zebrafish larvae. (A) Fluorescent photomicrograph of zebrafish larvae stained with Rho-123; (B) Analysis of mitochondrial polarization; (C) Quantification of ionocytes. Data are presented as mean ± standard deviation of triplicates. The asterix represents the statistical significance compared to the DMBA group. Scale bar: 400 µm and 100 µm. |
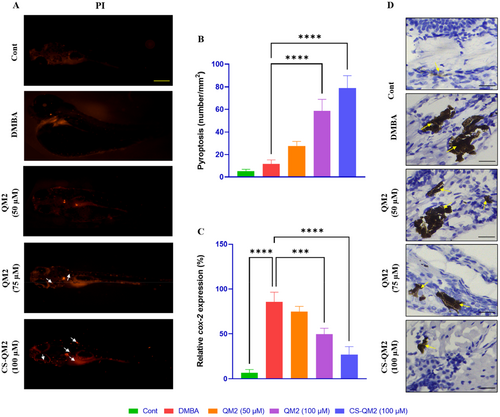
Representation of the cell death and cox-2 expression in zebrafish larvae. (A) Fluorescent photomicrograph of zebrafish larvae stained with PI; white arrow indicates pyroptosis, scale bar: 400 µm; (B) Quantification of pyroptosis; (C) Quantification of cox-2 expression level; (D) Photomicrograph of an immunohistochemistry of zebrafish larvae expressing cox-2; yellow arrow indicates cox-2 expression, scale bar: 30 µm. Data are presented as mean ± standard deviation of replicates. The asterix represents the statistical significance compared to the DMBA group. |