
Fig. 4
- ID
- ZDB-FIG-250423-24
- Publication
- Korzeniwsky et al., 2025 - Dominant Negative Mitf Allele Impacts Melanophore and Xanthophore Development and Reveals Collaborative Interactions With Tfec in Zebrafish Chromatophore Lineages
- Other Figures
- All Figure Page
- Back to All Figure Page
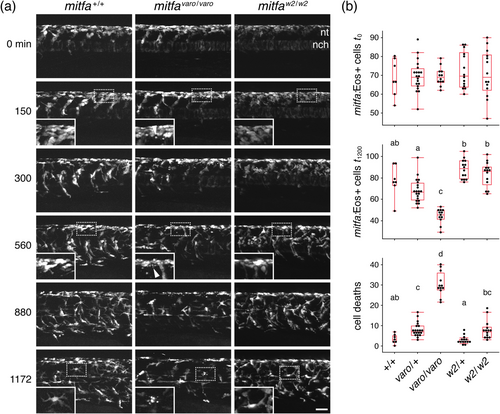
Time-lapse imaging reveals the death of mitfa:Eos+ cells in varo mutants. (a) Example image series from wild-type and homozygous mutant varo siblings, as well as a mitfaw2 homozygous mutant, imaged at the level of the posterior yolk extension for 20 h beginning at 22 h post-fertilization. nt, level of neural tube. nch, notochord (weakly fluorescent with this reporter). Insets show normal morphologies of cells in wild-type and mitfaw2, and cellular debris (arrowheads) present from early time points in all varo mutants. Such debris was also apparent in embryos not subjected to time-lapse imaging (Figure S4). (b) Box plots show reduced numbers of mitfa + cells in mitfavaro heterozygotes and homozygotes, as compared to wild-types and mitfaw2 at the end of imaging (overall Kruskal–Wallis χ2 = 42.4, 4 df, p < 0.0001), without significant differences at the beginning of imaging (χ2 = 0.6, 4 df, p = 0.9). Differences were associated with an incidence of cell death (lower plot) markedly greater in varo−/− than in other genotypes (χ2 = 45.9, 4 df, p < 0.0001). Shared letters above groups indicate medians not significantly different from one another (p > 0.05) in post hoc comparisons (non-parametric Steel-Dwass method). N = 67 embryos, using sibling mitfa+/+, mitfavaro/+ and mitfavaro/varo, and sibling mitfaw2/+ and mitfaw2/w2. The scale bar: 50 μm. |