
Fig. 2
- ID
- ZDB-FIG-250423-22
- Publication
- Korzeniwsky et al., 2025 - Dominant Negative Mitf Allele Impacts Melanophore and Xanthophore Development and Reveals Collaborative Interactions With Tfec in Zebrafish Chromatophore Lineages
- Other Figures
- All Figure Page
- Back to All Figure Page
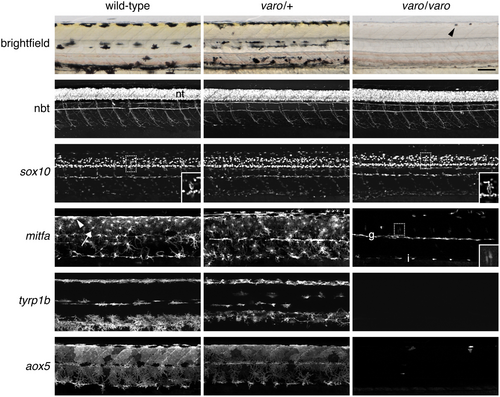
varo affects developing melanophores and xanthophores. Brightfield and fluorescent reporter lines in wild-type and varo mutant siblings at 72 h post-fertilization (hpf). For each reporter, all genotypes were imaged with the same acquisition times, with extended focus projections shown except where indicated. nbt:DsRed and sox10:Eos expression in the neural tube (nt) and peripheral nervous system were indistinguishable among genotypes. Insets show single focal plane details of sox10+ cells in the dorsal root ganglia. mitfa:Eos, like mitfa transcript (Lister et al. 1999; Parichy et al. 2000), was detectable in wild-type melanophores (e.g., arrowhead), xanthophores (arrow), and their precursors. In varo−/− mutants, few mitfa+ cells were present. The inset shows two faint mitfa+ cells near the dorsal root ganglia at a higher display value. g, mitfa+ glia along the lateral line nerve; i, presumptive mitfa+ iridophores, which also exhibit detectable mitfa transcript. tyrp1b:PALM-mCherry marked melanophores and melanoblasts in wild-type and varo/+, but tyrp1b+ cells were missing in varo/varo. aox5:PALM-EGFP marked xanthophores and xanthoblasts, with aox5 cells mostly absent in varo/varo. The arrowhead in the brightfield image of varo/varo indicates one of two visible iridophores, which appear dark in the transmitted illumination used here. Scale bar: 100 μm. |