
- Title
-
Dominant Negative Mitf Allele Impacts Melanophore and Xanthophore Development and Reveals Collaborative Interactions With Tfec in Zebrafish Chromatophore Lineages
- Authors
- Korzeniwsky, K.G., de Mello, P.L.H., Liang, Y., Feltes, M., Farber, S.A., Parichy, D.M.
- Source
- Full text @ Pigment Cell Melanoma Res.

Phenotypes of varo mutant. (a) Early larvae had irregular patterns of melanophores if heterozygous and lacked melanophores and xanthophores if homozygous. Insets show normal yellow color from xanthophores, posterior to otocyst, ectopic and hypomelanized melanophores, with yellow color of xanthophores in heterozygote and absence of melanophores and xanthophore color in homozygote. Arrowheads, persisting iridophores in normal locations in the homozygote, as a sheet of cells above the swim bladder and as individual cells along dorsal midline. Counts of dorsal iridophores did not differ among wild-type, heterozygous or homozygous siblings (F2,36 = 1.07, p = 0.4). (b) Adult heterozygotes had irregular stripes with melanophores that contained less melanin than the wild type, whereas homozygotes lacked stripes as well as melanophores and xanthophores. Details of flanks and fins are shown after treating with epinephrine to contract pigment granules towards cell centers. Flank insets: Details of areas outlined by dashed squares show pseudocolored xanthophores in bright yellow–orange on a dark background (Figure S1a); details of areas outlined by solid squares illustrate melanophores, iridophores (iridescent or purplish grey) or both. Fin insets: Dashed squares, pseudocolored xanthophores; solid squares, melanophores and xanthophores; dashed rectangles, iridophores (iridescent or purplish, examples circled), and xantholeucophores (orange–brown). Scale bars: A, 100 μm; b, 200 μm flank, 500 μm fin. |
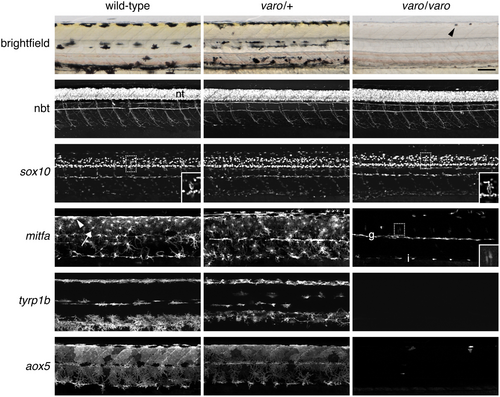
varo affects developing melanophores and xanthophores. Brightfield and fluorescent reporter lines in wild-type and varo mutant siblings at 72 h post-fertilization (hpf). For each reporter, all genotypes were imaged with the same acquisition times, with extended focus projections shown except where indicated. nbt:DsRed and sox10:Eos expression in the neural tube (nt) and peripheral nervous system were indistinguishable among genotypes. Insets show single focal plane details of sox10+ cells in the dorsal root ganglia. mitfa:Eos, like mitfa transcript (Lister et al. 1999; Parichy et al. 2000), was detectable in wild-type melanophores (e.g., arrowhead), xanthophores (arrow), and their precursors. In varo−/− mutants, few mitfa+ cells were present. The inset shows two faint mitfa+ cells near the dorsal root ganglia at a higher display value. g, mitfa+ glia along the lateral line nerve; i, presumptive mitfa+ iridophores, which also exhibit detectable mitfa transcript. tyrp1b:PALM-mCherry marked melanophores and melanoblasts in wild-type and varo/+, but tyrp1b+ cells were missing in varo/varo. aox5:PALM-EGFP marked xanthophores and xanthoblasts, with aox5 cells mostly absent in varo/varo. The arrowhead in the brightfield image of varo/varo indicates one of two visible iridophores, which appear dark in the transmitted illumination used here. Scale bar: 100 μm. |
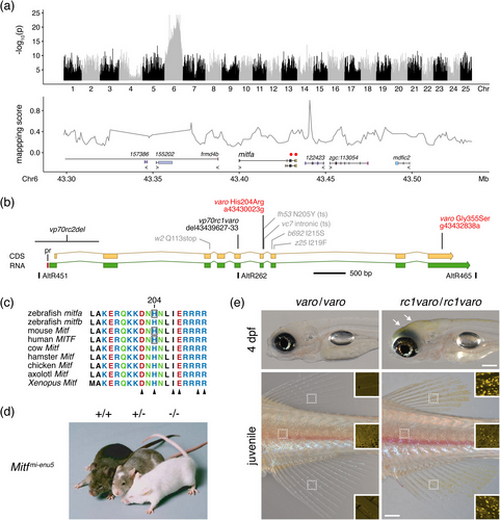
varo is allelic to mitfa. (a) Association mapping by whole-genome resequencing placed varo on Chr6 in the vicinity of mitfa (upper). Only two potentially deleterious variants were identified (red circles, lower), both perfectly associated with phenotype and both in exons of mitfa. Numbered, anonymous loci indicate Ensembl transcript identifiers (ensdart…). (b) Two missense substitutions in varo are shown in red (nucleotide coordinates reference GRCz11). Additional alleles generated in this study are shown in black (see main text), and previously identified alleles (Johnson et al. 2011; Lister et al. 2001, 1999) are shown in grey (ts, temperature sensitive). The locations of AltR CRISPR/Cas9 targets are shown below the gene body with AltR451, AltR465 used to generate a deletion allele (see main text). pr, conserved promoter element (Baranasic et al. 2022) (c) Alignment illustrating near-invariance of the basic region of the DNA-binding domain across species. Sequence translation from the second zebrafish Mitf gene, mitfb, is included. Histidine residues are boxed for species reported to have ENU-induced or natural His→Arg missense substitutions, as in varo. Arrowheads indicate sites of missense mutations with dominant negative activities (Hallsson et al. 2000; Hansdottir et al. 2004; Hemesath et al. 1994; Philipp et al. 2011; Yamamoto et al. 2024). (d) Mice that are wild-type, heterozygous or homozygous for an H209R allele (reproduced with permission from Hansdottir et al. 2004). (e) Homozygous varo and homozygous varo with premature termination codon (mitfavp70rc1varo, 7 base pair deletion leading to 11 novel amino acids followed by a stop codon). Introduction of a non-sense mutation on the varo background restored xanthophores in larvae (arrowheads) and adults (insets) when homozygous and abolished semi-dominance when heterozygous (mitfavp70rc1varo/+). Dark spots in insets are due to iridophore iridescence. Scale bars: Upper, 200 μm; lower, 500 μm. |
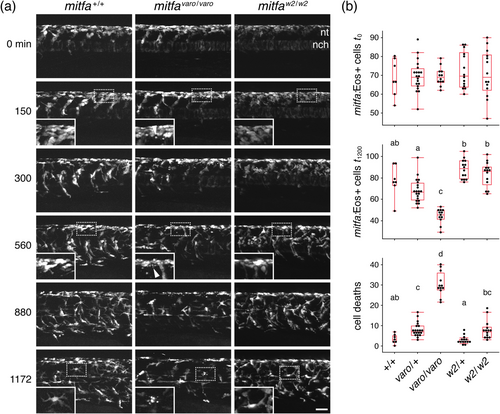
Time-lapse imaging reveals the death of mitfa:Eos+ cells in varo mutants. (a) Example image series from wild-type and homozygous mutant varo siblings, as well as a mitfaw2 homozygous mutant, imaged at the level of the posterior yolk extension for 20 h beginning at 22 h post-fertilization. nt, level of neural tube. nch, notochord (weakly fluorescent with this reporter). Insets show normal morphologies of cells in wild-type and mitfaw2, and cellular debris (arrowheads) present from early time points in all varo mutants. Such debris was also apparent in embryos not subjected to time-lapse imaging (Figure S4). (b) Box plots show reduced numbers of mitfa + cells in mitfavaro heterozygotes and homozygotes, as compared to wild-types and mitfaw2 at the end of imaging (overall Kruskal–Wallis χ2 = 42.4, 4 df, p < 0.0001), without significant differences at the beginning of imaging (χ2 = 0.6, 4 df, p = 0.9). Differences were associated with an incidence of cell death (lower plot) markedly greater in varo−/− than in other genotypes (χ2 = 45.9, 4 df, p < 0.0001). Shared letters above groups indicate medians not significantly different from one another (p > 0.05) in post hoc comparisons (non-parametric Steel-Dwass method). N = 67 embryos, using sibling mitfa+/+, mitfavaro/+ and mitfavaro/varo, and sibling mitfaw2/+ and mitfaw2/w2. The scale bar: 50 μm. |
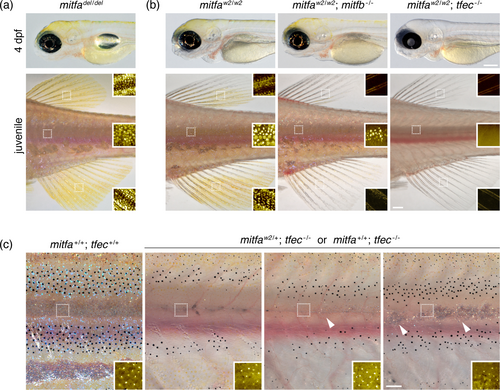
Deletion and double mutant analyses suggest interactions of Mitfa with other bHLH-ZIP MiT subfamily members. (a) Mutants homozygous for a deletion (mitfadel) that prevents mitfa transcription developed abundant embryonic and adult xanthophores. (b) Double mutants for mitfaw2 and mitfb developed xanthophores, albeit fewer in the adult than mitfaw2 single mutants, with this deficit noticeable especially in fins. Double mutants for mitfaw2 and tfec completely lacked xanthophores in early larvae. tfec mutants were semi-viable through later larval stages owing to defects in swim bladder development and potentially other traits, but surviving mitfa; tfec mutant juveniles and adults lacked xanthophores, despite their presence in tfec single mutants (Petratou et al. 2021) (e.g., Figure S8b,c). (c) tfec homozygotes often recovered adult iridophores if wild-type or heterozygous mutant for mitfa. The left panel shows wild-type and three right panels show variable complements of iridophores in sibling tfec−/− fish with one or two mitfa+ alleles (individuals with iridophores: mitfaw2/+, 4 of 7 genotyped; mitfa+/+, 2 of 3 genotyped). Whole-fish images of adults are also shown in Figure S8a. Scale bars: For a and b, upper 200 μm, lower 500 μm; c, 250 μm. |
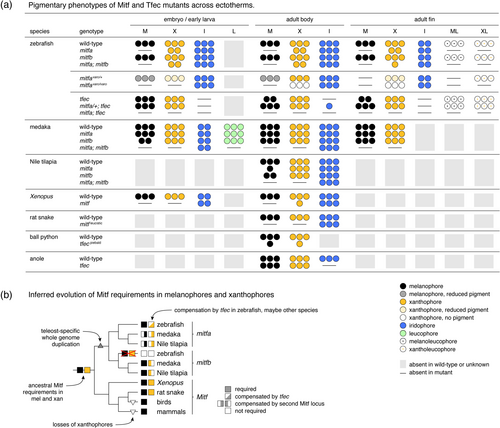
Pigmentary phenotypes of Mitf and Tfec mutants and inferred evolution of Mitf requirements. (a) Several studies have now examined phenotypes resulting from Mitf or Tfec mutation. Summary illustrates for indicated pigment cell classes absences, reduced numbers or changes in states across life stages and anatomical locations when relevant and described (this study; Garcia- Elfring et al. 2023; Lane and Lister 2012; Lister et al. 1999; Miyadai et al. 2023; Ran et al. 2024; Tzika 2024; Ullate-Agote and Tzika 2021; Wang et al. 2021). Reduced numbers of cells indicated by fewer symbols are not intended to be quantitative. Key shown at lower right. (b) Observations available so far suggest an ancestral vertebrate requirement for Mitf in both melanophores and xanthophores. With an additional whole-genome duplication in teleosts, Mitf continued to be required but loss of one Mitf locus could be compensated by another. Only in zebrafish has one Mitf locus, mitfb, undergone a substantial, though not complete (Figure 5b) reduction in pigmentary function (loss of requirements by melanophores and xanthophores marked with red X), with compensation for mitfa loss from the more distant MiT subfamily member gene, tfec, and only to a lesser extent mitfb. |