
FIGURE
Figure 11
- ID
- ZDB-FIG-250329-94
- Publication
- Zhou et al., 2025 - The Interaction Between the asb5a and asb5b Subtypes Jointly Regulates the L-R Asymmetrical Development of the Heart in Zebrafish
- Other Figures
- All Figure Page
- Back to All Figure Page
Figure 11
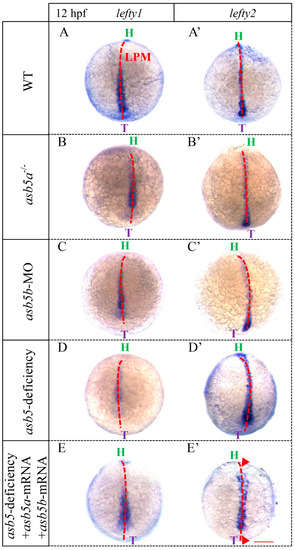
WISH results utilizing |
Expression Data
Expression Detail
Antibody Labeling
Phenotype Data
Phenotype Detail
Acknowledgments
This image is the copyrighted work of the attributed author or publisher, and
ZFIN has permission only to display this image to its users.
Additional permissions should be obtained from the applicable author or publisher of the image.
Full text @ Int. J. Mol. Sci.