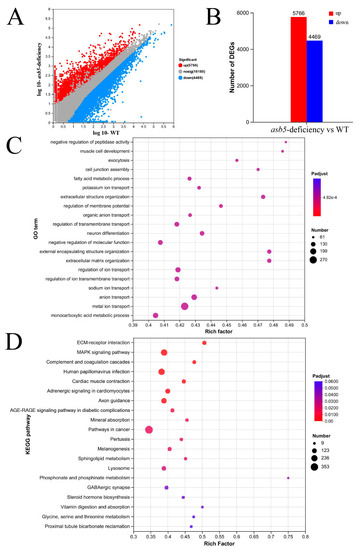
The impact of asb5 loss on the transcriptome of 48 hpf zebrafish embryos. (A) The scatter plot displays expression differences for differentially expressed genes (DEGs), with blue dots indicating downregulated genes, red dots representing upregulated genes, and gray dots denoting genes with no significant expression differences across conditions (significance threshold: |log2FC| > 2.0 and p < 0.05). (B) The statistical chart summarizes expression differences for DEGs, where the red box highlights upregulated genes and the blue box indicates downregulated genes. (C) The bubble chart visualizes GO enrichment analysis for DEGs, with the vertical axis representing GO terms and the horizontal axis indicating the Rich factor, whereby a larger Rich factor signifies a higher degree of enrichment. The size of the bubbles corresponds to the number of genes/transcripts associated with each GO term, while the color of the dots corresponds to various ranges of Padjust. (D) The bubble chart depicts a KEGG pathway enrichment analysis for DEGs. The vertical axis lists the pathway names, while the horizontal axis indicates the Rich factor, where a larger Rich factor denotes a higher degree of enrichment. The size of the bubbles represents the number of genes in each pathway, and the color of the bubbles corresponds to varying ranges of Padjust.
|
