FIGURE SUMMARY
Title

The Interaction Between the asb5a and asb5b Subtypes Jointly Regulates the L-R Asymmetrical Development of the Heart in Zebrafish

Authors
Zhou, W., Cai, W., Li, Y., Gao, L., Liu, X., Liu, S., Lei, J., Zhang, J., Wang, Y., Jiang, Z., Wu, X., Fan, X., Li, F., Zheng, L., Yuan, W.
Source
Full text @ Int. J. Mol. Sci.

The impact of asb5a/asb5b deficiency on L-R asymmetry in cardiac development. (AF) Representative images of the pericardial cavity in various groups at 48 hpf during embryonic development; scale bar = 200 µm (side view). (A′F′) Representative images of heart positioning in different zebrafish groups at 48 hpf under the myl7:EGFP background; scale bar = 100 µm (belly up view); (A″F″) Magnified images of the atria and ventricles in various zebrafish groups at 48 hpf, also under the myl7:EGFP background, scale bar = 50 µm (belly up view). The red triangular arrows indicate areas of enlargement in the cardiac pericardial cavity. BF: bright field; GF: green fluorescence; 10X: field of view under a 10× microscope; 20X: field of view under a 20× microscope; red E: eyes; red V: ventricle; yellow A: atrium; D-loop: dextral looping; N-loop: no looping; L-loop: levo-looping.

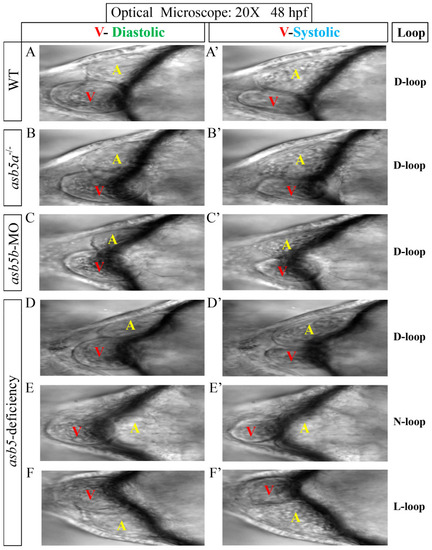
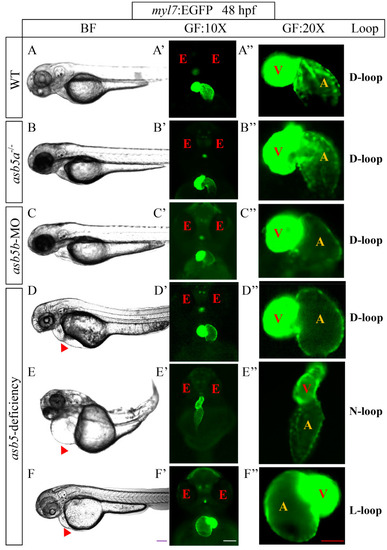
The morphological changes following the inactivation of asb5a/asb5b. The 10 s M-mode screenshot clearly displays the diastolic and systolic shapes of the ventricle and atrium. (AF) Schematic diagrams of cardiac looping during diastole of the ventricle in various groups of zebrafish at 48 hpf. (A′F′) Schematic diagrams of cardiac looping during ventricular systole in these same groups of zebrafish at 48 hpf. 20X: field of view under a 20× microscope; red V: ventricle; yellow A: atrium; D-loop: dextral looping; N-loop: no looping; L-loop: levo-looping.

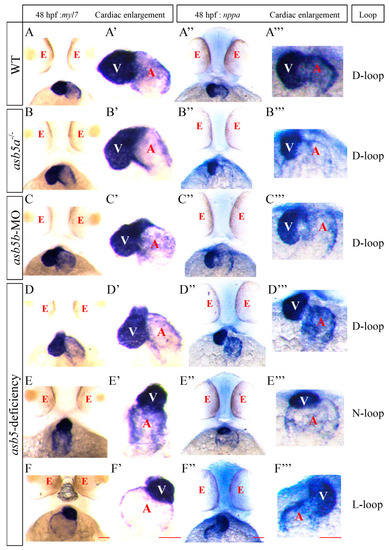
WISH analysis of heart looping at 48 hpf in the asb5-deficiency group, utilizing myl7 and nppa probes. (AF) Schematic diagrams of heart positions marked with myl7 probes in different groups at 48 hpf. (A′F′) Enlarged views of these heart positions as indicated by myl7 probes. (A″F″) Schematic diagrams of heart positions marked with nppa probes in various groups at 48 hpf. (A′′′F′′′) present enlarged views of these positions as indicated by nppa probes. Scale bar = 100 µm (belly up view). red E: eyes; white V: ventricle; red A: atrium; D-loop: dextral looping; N-loop: no looping; L-loop: levo-looping.

WISH results using vmhc and amhc probes at 48 hpf in zebrafish embryos. (AF) Schematic representations of ventricular positions labeled by the vmhc probe across different groups at 48 hpf. (A′F′) Enlarged images of ventricular tissues labeled by the vmhc probe in these groups. (A″F″) Schematic representation of the atrial positions labeled by the amhc probe across various groups at 48 hpf. (A′′′F′′′) Enlarged images of atrial tissues labeled by the amhc probe in these groups. red E: eyes; white V: ventricle; red A: atrium; Normal: Normal position; Middle: Middle position; Reverse: Reverse position; Scale bar = 100 µm (belly up view).

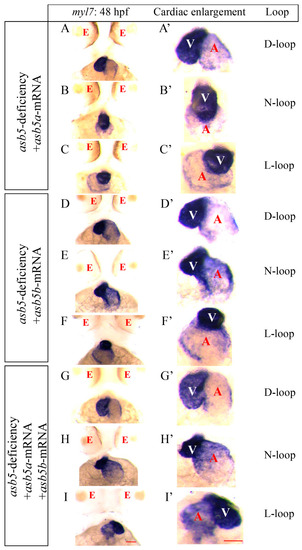
Rescue experiments conducted on the asb5-deficiency group marked by the myl7 probe in embryos at 48 hpf. (AC) Injection of asb5a-mRNA alone did not rescue the abnormal looping phenotype. (DF) Injection of asb5b-mRNA alone also failed to rescue the abnormal phenotype. Images (GI) show that the simultaneous injection of asb5a and asb5b-mRNA effectively rescued the phenotype in the asb5-deficiency group. Images (A′I′) present magnified images of the heart, marked by the myl7 probe, from various groups of embryos at 48 hpf. red E: eyes; white V: ventricle; red A: atrium; D-loop: dextral looping; N-loop: no looping; L-loop: levo-looping; Scale bar = 100 µm (belly up view).

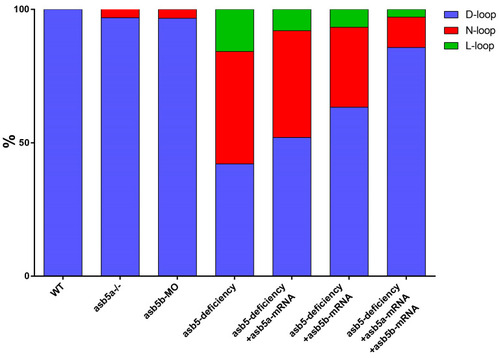
Statistical chart of rescue experiments conducted across various groups. WT: Wild-type control group.
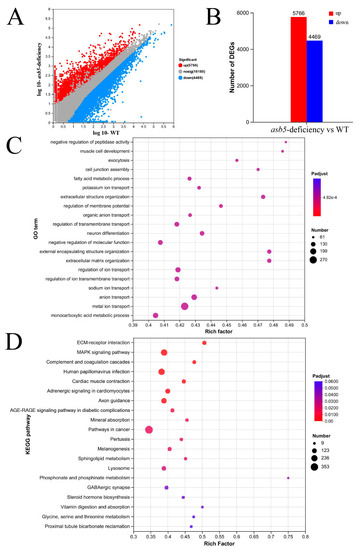
 asb5a-/-: asb5a knockout homozygous group. asb5b-MO: asb5b knockdown group. asb5-deficiency: Simultaneous knockdown of asb5b group in asb5a-/- homozygous embryos (loss of asb5 group). asb5-deficiency + asb5a-mRNA: injection of asb5a-mRNA alone in the asb5-deficiency group. asb5-deficiency + asb5b-mRNA: injection of asb5b-mRNA alone in the asb5-deficiency group. asb5-deficiency + asb5a-mRNA + asb5b-mRNA: Simultaneous injection of asb5a-mRNA and asb5b-mRNA in the asb5-deficiency group (double rescue group). D-loop: dextral looping; N-loop: no looping; L-loop: levo-looping.

The impact of asb5 loss on the transcriptome of 48 hpf zebrafish embryos. (A) The scatter plot displays expression differences for differentially expressed genes (DEGs), with blue dots indicating downregulated genes, red dots representing upregulated genes, and gray dots denoting genes with no significant expression differences across conditions (significance threshold: |log2FC| > 2.0 and p < 0.05). (B) The statistical chart summarizes expression differences for DEGs, where the red box highlights upregulated genes and the blue box indicates downregulated genes. (C) The bubble chart visualizes GO enrichment analysis for DEGs, with the vertical axis representing GO terms and the horizontal axis indicating the Rich factor, whereby a larger Rich factor signifies a higher degree of enrichment. The size of the bubbles corresponds to the number of genes/transcripts associated with each GO term, while the color of the dots corresponds to various ranges of Padjust. (D) The bubble chart depicts a KEGG pathway enrichment analysis for DEGs. The vertical axis lists the pathway names, while the horizontal axis indicates the Rich factor, where a larger Rich factor denotes a higher degree of enrichment. The size of the bubbles represents the number of genes in each pathway, and the color of the bubbles corresponds to varying ranges of Padjust.

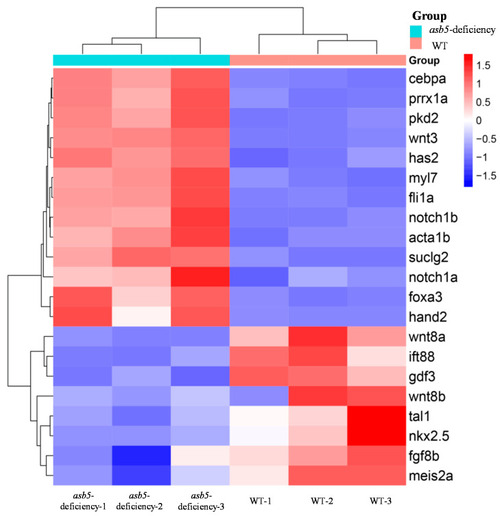
Summary chart of RNA-Seq data for the regulation of asymmetrically developing genes in 48 hpf zebrafish embryos. Heatmap of DEGs, where rows represent genes and columns represent samples. The red and blue colors indicate high and low expression levels, respectively, with darker colors denoting more pronounced significant differences.

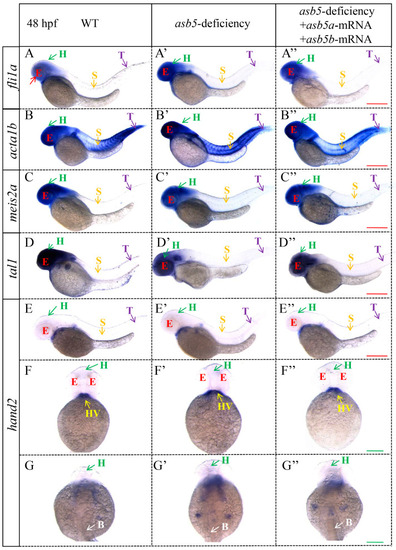
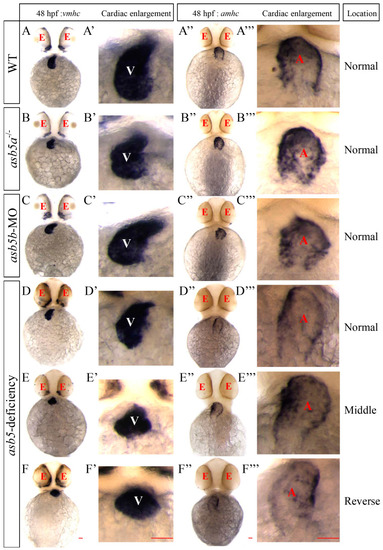
WISH results for genes associated with L-R asymmetric development in 48 hpf zebrafish embryos. Images (AA″) illustrate the WISH expression of fli1a in WT, asb5-deficient, and asb5-deficient +asb5a/asb5b-mRNA groups (side view). Images (BB″) display the WISH expression of acta1b across the different groups (side view). Images (CC″) show the WISH expression of meis2a in various groups (side view). Images (DD″) present the WISH expression of tal1 in different groups (side view). Images (EE″) display the WISH expression of hand2 across various groups (side view). Images (FF″) depict the WISH expression of hand2 in the multiple groups (abdominal view). Images (GG″) show the WISH expression of hand2 in different groups (back view). red E: eyes; green H: head; orange S: skeletal muscle; purple T: tail; yellow HV: heart valves; white B: back; Red scale bar = 500 µm; Green scale bar = 250 µm.

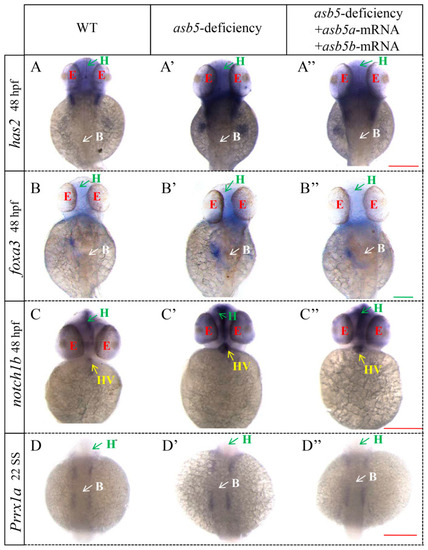
WISH results for other genes related to L-R asymmetric development in zebrafish embryos at 48 hpf across various groups. Images (AA″) illustrate the WISH expression of has2 in WT, asb5-deficiency group, and asb5-deficiency group + asb5a/asb5b-mRNA group (back view). Images (BB″) show the WISH expression of foxa3 across different groups (back view). Images (CC″) depict the WISH expression of notch1b in various groups (abdominal view). Images (DD″) present the WISH expression of prrx1a in the same groups (abdominal view). 22 SS: 22 somite stage; green H: head; white B: back; red E: eyes; yellow HV: heart valves; Red scale bar = 500 µm; Green scale bar = 250 µm.

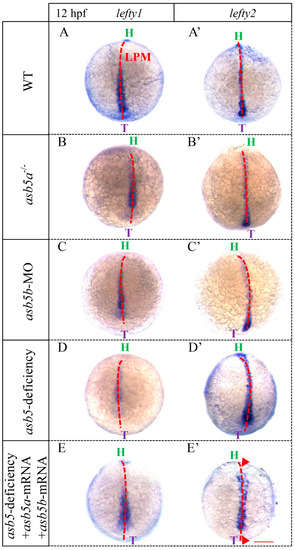
WISH results utilizing lefty1 and lefty2 probes in embryos at 12 hpf across various groups. Images (AE) depict schematic diagrams illustrating lefty1 expression in the LPM of the embryos. Images (A′E′) show corresponding schematic diagrams for lefty2 expression in the LPM of the embryos. green H: head; purple T: tail; LPM: lateral plate mesoderm; red triangular arrow: indicates the region where lefty2 expression is downregulated following double rescue; Scale bar = 500 µm (back up view).

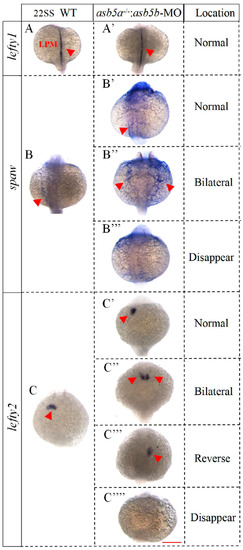
WISH results in WT and the asb5-deficiency group zebrafish embryos at 22 SS. (AA′) The schematic diagram illustrates the expression of lefty1 in the LPM of the embryos. (BB′′′) This diagram depicts spaw expression in proximity to the LPM. In the WT group, spaw is localized on the left side of the LPM, whereas the asb5-deficiency group displays three distinct expression patterns: left-side expression, bilateral expression, and absence of expression. (CC′′′′) The schematic diagram shows lefty2 expression near the LPM in embryos. In the WT group, lefty2 is expressed on the left side of the LPM, while the asb5-deficiency group reveals four expression patterns: left-side expression, bilateral expression, reverse expression, and no expression. LPM: lateral plate mesoderm; Red triangular arrow: positive expression region; Scale bar = 500 µm (back up view).

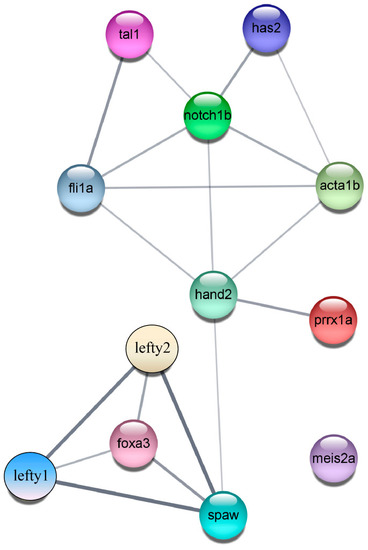
PPI regulatory network diagram. The PPI network comprises three modules, consisting of a total of 12 nodes and 18 edges.

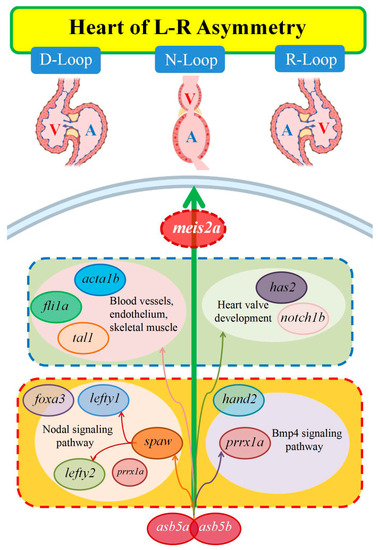
This molecular regulatory network diagram illustrates the influence of asb5a/asb5b on the L-R asymmetric development of the heart in zebrafish. V: ventricle; A: atrium; D-loop: dextral looping; N-loop: no looping; L-loop: levo-looping.

Acknowledgments
This image is the copyrighted work of the attributed author or publisher, and ZFIN has permission only to display this image to its users. Additional permissions should be obtained from the applicable author or publisher of the image. Full text @ Int. J. Mol. Sci.