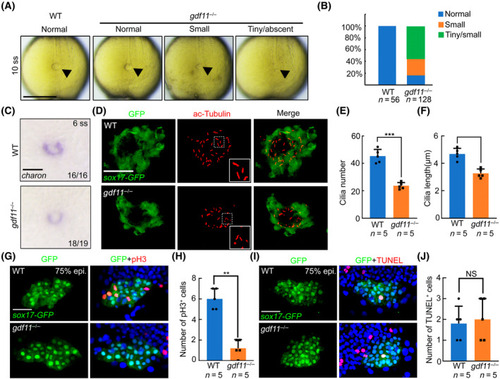
gdf11 is required for DFC proliferation and KV cilia formation. (A) Live image of Kupffer's vesicle at the 10‐somite stage in both WT and gdf11−/− mutants. Scale bar, 200 μm. (B) Percentage of KV size in WT and gdf1−/− mutants. (C) in situ hybridizations of charon were used to assess Kupffer's vesicle lumen size at 6 ss. Scale bar, 100 μm. (D) Visualization of KV cilia at the 10‐somite stage using an anti‐acetylated tubulin antibody in control or gdf11−/− embryos of the Tg(sox17‐GFP) line, showing both KV cells (green) and cilia (red). Scale bar, 50 μm. (E,F) Number (E) and length (F) of KV cilia in WT and mutant embryos. Graph indicates the mean of cilia number and length, error bars represent the standard deviation. Statistical significance between WT and gdf11−/− mutants was determined using a two‐tailed unpaired t‐test. (G, H) Confocal images of 75% epiboly zebrafish embryos with pH3 staining in a Tg(sox17‐GFP) background (G). Quantification of pH3 positive cells (H). Error bars represent the standard deviation. Statistical significance was determined using a two‐tailed unpaired t‐test. Scale bar, 50 μm. (I, J) Confocal images of 75% epiboly zebrafish embryos with TUNEL staining in a Tg(sox17‐GFP) background (I). Quantification of TUNEL positive cells (J). Error bars represent the standard deviation. Statistical significance was determined using a two‐tailed unpaired t‐test. Scale bar, 50 μm.
|
