|
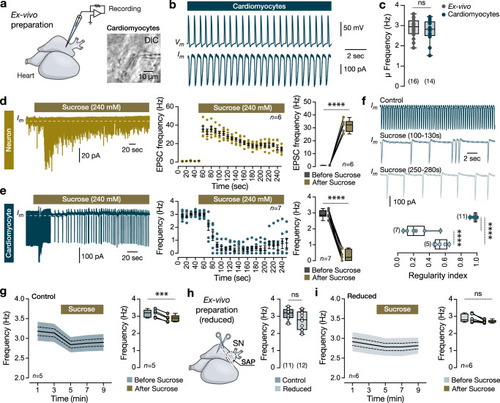
Functional changes in heart rate. a Ex-vivo preparation of an isolated adult zebrafish heart allows whole-cell patch-clamp recordings of atrial cardiomyocytes. Image of a recorded cardiomyocyte. b Representative current- and voltage-clamp traces from recorded cardiomyocytes. c Mean heart rate frequency (Hz) of the recorded cardiomyocytes and the ex-vivo video-recorded hearts. d Voltage-clamp recording from an IcNS neuron shows the increase of the detected excitatory post-synaptic currents (EPSCs) after bath application of sucrose. Data are presented as mean values ± SEM. Analysis of the EPSCs frequency (Hz) before and following the Sucrose. e A sample trace from a cardiomyocyte recording in voltage-clamp mode shows a disruption of the firing frequency following sucrose application. Data are presented as mean values ± SEM. Quantification of the cardiomyocyte firing before and after the application of Sucrose. f Sample traces from a cardiomyocyte before and after the application of sucrose and analysis of the firing regularity. g Time-course analysis of the heart rate frequency extracted from video recordings of the ex-vivo adult zebrafish heart and quantification of the heart frequency before and after the application of sucrose. The shaded area defines the standard deviation, and the dotted line is the standard error of the mean (solid line). h Reduced ex-vivo adult heart preparation after removal of the sinus venosus (SN) and SAP neurons. Analysis of the heart average frequency (Hz). i Time-course analysis and quantification of heart frequency extracted from ex-vivo reduced zebrafish heart videos before and after sucrose application. The shaded area defines the standard deviation, and the dotted line is the standard error of the mean (solid line). All cells were held at −75mV (voltage-clamp recordings). DIC, Differential interference contrast; SAP, sinoatrial plexus; SN, sinus venosus. Data are presented as box plots showing the median with 25/75 percentile (box and line) and minimum–maximum (whiskers). ***P < 0.001; ****P < 0.0001; ns, not significant. For detailed statistics, see Supplementary Table 1. Source data are provided as a Source Data file.
|