FIGURE SUMMARY
Title

Decoding the molecular, cellular, and functional heterogeneity of zebrafish intracardiac nervous system

Authors
Pedroni, A., Yilmaz, E., Del Vecchio, L., Bhattarai, P., Vidal, I.T., Dai, Y.E., Koutsogiannis, K., Kizil, C., Ampatzis, K.
Source
Full text @ Nat. Commun.

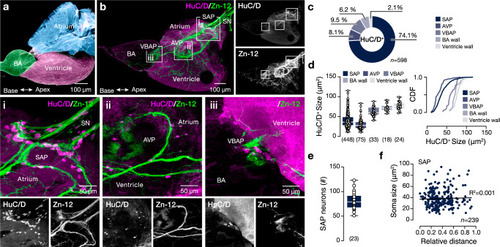
Neuroanatomy of the adult zebrafish intracardiac nervous system.

a Color-coded presentation of the major regions of the adult zebrafish prototypic heart. b A representative whole-mount photomicrograph shows the general innervation pattern of the adult zebrafish heart with Zn-12 immunostaining (neuronal processes) and HuC/D (neuronal somata). The regions around the valves connecting the heart chambers hold the majority of the observed HuC/D+ neuronal somata (inserts i-iii). c Quantification of the proportion of HuC/D+ neurons found in different heart regions. d Regionalized quantification of the HuC/D+ cell soma size in the adult zebrafish heart. e Quantification of the total number of the HuC/D labeled neurons in the SAP area. f Analysis of the neuronal soma size in relation to relative distance from the sinoatrial valve. AVP atrioventricular plexus, BA bulbus arteriosus, CDF cumulative distribution frequency, HuC/D elav3&4, SAP sinoatrial plexus, SN sinus venosus, VBAP ventriculo-bulbus arteriosus plexus, Zn-12 neuronal cell surface marker (HNK-1). Data are presented as box plots showing the median with 25/75 percentile (box and line) and minimum-maximum (whiskers) and as mean ± SEM. For detailed statistics, see Supplementary Table 1. Source data are provided as a Source Data file.

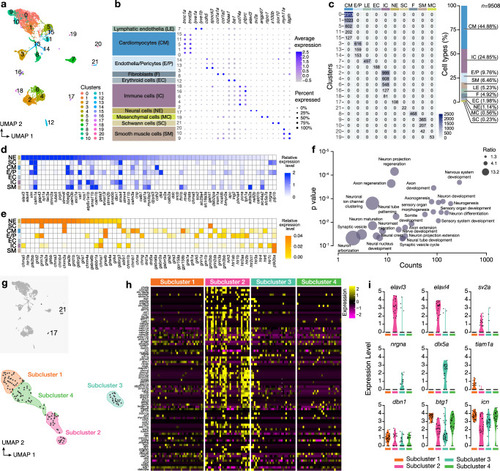
Single-cell transcriptomics from the adult zebrafish heart.

a UMAP clustering plot identifies 22 cell distinct clusters colored differentially. b Dot plot of the average expression level in different cell clusters (color) and percentage of expressing cells (circle size) of selected marker genes for major cell populations (columns) across the adult zebrafish heart cells. c Heatmap for the number of cells sequenced per cell cluster. A bar plot showing the percent of cell types in single-cell samples. d Heatmap shows the expression of selected neuronal marker genes. e Heatmap presentation of the expression of neurotransmitter receptor genes in the neuronal cluster (NE) and non-neuronal clusters. f Selected gene ontology (GO) terms for neuronal cluster compared to other cell types in a multiple variable graph. The Y-axis indicates p values, and the X-axis shows the count number of genes in respective GO terms. Genes were identified through differential gene expression analyses. Bubble size indicates the odds ratio. g Subclustering of neurons (Cluster #17 and #21) identifies four subclusters (1 to 4). h Heatmap depicting the expression levels of a selected list of neuronal markers in all neuronal-related subclusters (from clusters #17 and #21). Every column indicates a cell, and every row represents a gene expression. The different neuronal subclusters are indicated and color-coded. i. Violin plots of the expression of selected genes in each distinct subcluster (color-coded).

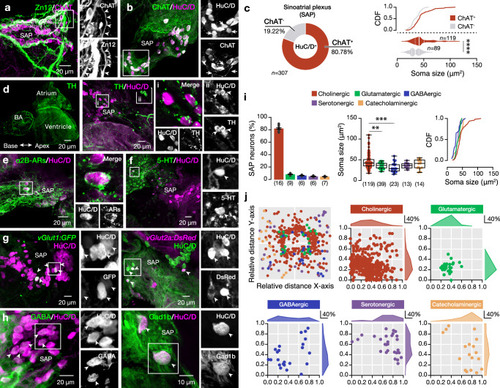
Neurochemical variability in the intracardiac SAP neuronal population.

a Representative whole-mount photomicrograph showing the abundance of cholinergic (ChAT+, magenta) neurons and processes in close contact with processes (Zn12+, green) innervating the SAP area. Arrowheads indicate the ChAT+/ Zn12+ neuronal processes. b, c Microphotograph showing that the majority but not all of the SAP neurons (HuC/D+) are cholinergic (ChAT+). Quantification of the proportion of the HuC/D+ that are cholinergic and analysis of the cholinergic (ChAT+) and non-cholinergic (ChAT-) SAP neuron soma sizes. Arrows indicate the non-cholinergic SAP neurons (HuC/D+/ ChAT-). d Whole-mount image shows the TH expression pattern on the adult zebrafish heart. Most SAP neurons (magenta) are in contact with TH+ processes (green) (in i). A small cluster of TH-expressing neurons in ii. e HuC/D+ neurons and processes in SAP express the adrenoceptor a2B, indicating the presence of strong adrenergic innervation. f Presence of serotonin (5-HT+) expressing neurons. g Identification of glutamatergic neurons (vGlut1+ and vGlut2a+) in SAP neuronal population. h SAP contains some GABAergic (GABA+ and Gad1b+, green) neurons. i. Analysis of the proportion of SAP neurons expressing different neurotransmitters. Quantification and cumulative frequency of the neurochemically distinct neuron soma sizes. j Spatial distribution pattern of neurons expressing different neurotransmitters in SAP area. Arrowheads indicate the double-labeled neurons. 5-HT 5-hydroxytryptamine/serotonin, AR adrenergic receptor, CDF cumulative distribution frequency, ChAT choline acetyltransferase, GABA γ-Aminobutyric acid, Gad1b Glutamate decarboxylase 1, HuC/D elav3 + 4, SAP sinoatrial plexus, TH Tyrosine Hydroxylase, vGlut vesicular glutamate transporter, Zn12 neuronal cell surface marker (HNK-1). Data are presented as mean ± s.e.m., as violin plots, or as box plots showing the median with 25/75 percentile (box and line) and minimum–maximum (whiskers). ****P < 0.0001. For detailed statistics, see Supplementary Table 1. Source data are provided as a Source Data file.

Diverse cellular properties of the intracardiac SAP neurons.

a Ex-vivo setup of an isolated intact adult zebrafish heart from the Tg(elav3:EGFP) line allows whole-cell patch-clamp recordings of SAP neurons. The dotted line indicates a recorded neuron. b The SAP neurons display distinct firing pattern properties and responses to hyperpolarizing and depolarizing current step injections. The depolarization current step injections from rheobase increased by 10% of rheobase. c Differential representation of the neuronal types in the SAP region of the adult zebrafish heart. d Normalized mean values (min to max) of the electrical properties observed for the SAP neuron types that are detailed described in Supplementary Fig. 4. Every column indicates a neuron and every row represents an electrical property. e Sample traces showing the variable spontaneous activity of the different SAP neuron firing classes recorded in the adult zebrafish heart. Analysis of the presence (proportion) and frequency of spontaneous action potentials between the SAP neurons. f Representative voltage-clamp traces show the spontaneous excitatory synaptic currents (EPSCs) between the different SAP neurons. Analysis of the detected EPSC frequency and amplitude. g The principal component analysis (PCA) plot depicts three clusters of SAP neurons based on physiological properties (dataset presented in d and e). Cells and data are colored by the assigned cell type (as in b). AHP, after-hyperpolarization potential; CDF, cumulative distribution frequency; DIC, Differential interference contrast; EPSC, excitatory postsynaptic current; GFP, green fluorescent protein; Rinput, input resistance; RMP, resting membrane potential; SAP, sinoatrial plexus. Data are presented as mean ± SEM and as violin plots. *P < 0.05; **P < 0.01; ***P < 0.001; ****P < 0.0001; ns, not significant. For detailed statistics, see Supplementary Table 1. Source data are provided as a Source Data file.

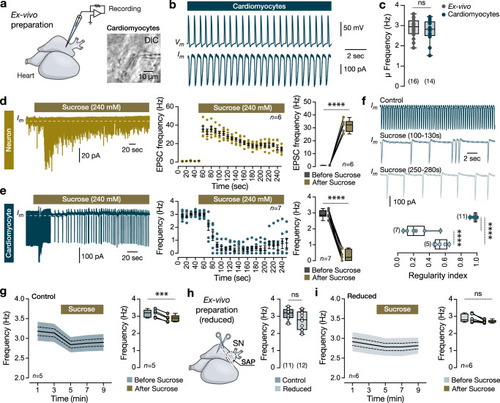
Functional changes in heart rate.

a Ex-vivo preparation of an isolated adult zebrafish heart allows whole-cell patch-clamp recordings of atrial cardiomyocytes. Image of a recorded cardiomyocyte. b Representative current- and voltage-clamp traces from recorded cardiomyocytes. c Mean heart rate frequency (Hz) of the recorded cardiomyocytes and the ex-vivo video-recorded hearts. d Voltage-clamp recording from an IcNS neuron shows the increase of the detected excitatory post-synaptic currents (EPSCs) after bath application of sucrose. Data are presented as mean values ± SEM. Analysis of the EPSCs frequency (Hz) before and following the Sucrose. e A sample trace from a cardiomyocyte recording in voltage-clamp mode shows a disruption of the firing frequency following sucrose application. Data are presented as mean values ± SEM. Quantification of the cardiomyocyte firing before and after the application of Sucrose. f Sample traces from a cardiomyocyte before and after the application of sucrose and analysis of the firing regularity. g Time-course analysis of the heart rate frequency extracted from video recordings of the ex-vivo adult zebrafish heart and quantification of the heart frequency before and after the application of sucrose. The shaded area defines the standard deviation, and the dotted line is the standard error of the mean (solid line). h Reduced ex-vivo adult heart preparation after removal of the sinus venosus (SN) and SAP neurons. Analysis of the heart average frequency (Hz). i Time-course analysis and quantification of heart frequency extracted from ex-vivo reduced zebrafish heart videos before and after sucrose application. The shaded area defines the standard deviation, and the dotted line is the standard error of the mean (solid line). All cells were held at −75mV (voltage-clamp recordings). DIC, Differential interference contrast; SAP, sinoatrial plexus; SN, sinus venosus. Data are presented as box plots showing the median with 25/75 percentile (box and line) and minimum–maximum (whiskers). ***P < 0.001; ****P < 0.0001; ns, not significant. For detailed statistics, see Supplementary Table 1. Source data are provided as a Source Data file.

Acknowledgments
This image is the copyrighted work of the attributed author or publisher, and ZFIN has permission only to display this image to its users. Additional permissions should be obtained from the applicable author or publisher of the image. Full text @ Nat. Commun.