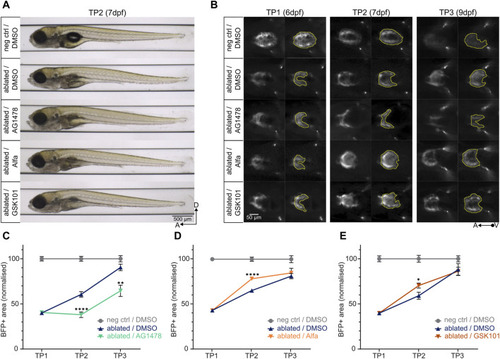
Determining the pro- and anti-regenerative effects of drugs on regeneration kinetics. (A) Larvae at TP2 after 24-h treatment with AG1478 (4.6 µM), Alfa (5 µM), or GSK101 (0.8 µM) do not show any significant developmental defects compared to the ablated control treated with 0.3% DMSO. (B) Representative images of ventral view of ventricles during systole (left) and BFP+ ventricular areas (right). At TP2, the treatment with AG1478 leads to a decrease in BFP+ ventricular area compared to ablated DMSO control; on the other hand, the treatment with Alfa and GSK101 leads to an increase. (C), (D), (E) Regeneration kinetics graphs after 24-h treatment with selected drugs between TP1 and TP2. Pro- and anti-regenerative effects of drugs can be assessed. For each condition, two separate experiments were performed, and values pooled after normalisation to corresponding negative control at each time point. (C) The treatment with AG1478 leads to a highly significant decrement in BFP+ area at both TP2 and TP3 compared to ablated DMSO control. TP1: N = 31, 31, 22; TP2: N = 24, 27, 22; TP3: N = 12, 16, 16 for negative DMSO control, ablated DMSO control, and AG1478 treated group, respectively. At TP2, p <0.0001; at TP3, p = 0.0012. (D) The treatment with Alfa leads to a highly significant increment in BFP + area at TP2 compared to ablated DMSO control. TP1: N = 32, 40, 29; TP2: N = 27, 29, 30; TP3: N = 12, 15, 16 for negative DMSO control, ablated DMSO control, and Alfa treated group, respectively. p <0.0001. (E) The treatment with GSK101 leads to a significant increment in BFP + area at TP2 compared to ablated DMSO control. TP1: N = 21, 35, 27; TP2: N = 17, 22, 20; TP3: N = 8, 11, 10 for negative DMSO control, ablated DMSO control, and GSK101 treated group, respectively. p = 0.0101.
|
