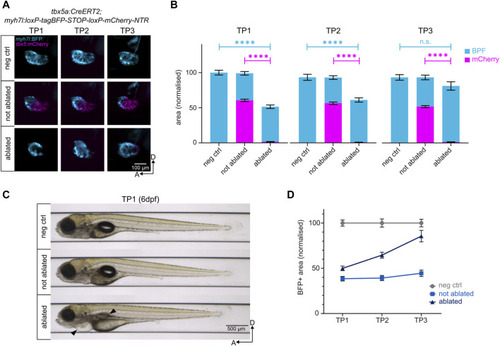
Genetic ablation of ventricular cardiomyocytes and subsequent regeneration. (A) Lateral view of the negative control, not ablated, and ablated ventricles. NTR-mCherry expressing cells undergo apoptosis in the ablated condition. The remaining BFP+ ventricular cardiomyocytes reconstruct the heart to levels comparable to the negative control by TP3. (B) Quantification of BFP+ and mCherry + areas of the ventricles after normalisation to negative control at each time point. At TP1, over 95% of NTR-mCherry expressing cells are ablated in the ablated condition. The BFP+ pool in ablated ventricles represents 45% of the BFP+ pool of the negative control ventricles. By TP3, it reaches approximately 85% of the BFP+ pool of the negative control ventricles. TP1: N = 35, 44, 42; TP2: N = 18, 39, 35; TP3: 14, 21, 19 for negative control, not ablated, and ablated larvae, respectively. (C) Automated imaging of negative control, not ablated, and ablated larvae at 6 dpf (TP1) through the VAST BioImager. Genetic cardiomyocyte ablation leads to the development of pericardial edema and swim bladder abnormality in ablated larvae (black arrows), consistent with a heart failure phenotype. (D) Regeneration kinetics graph. Representation of the BFP+ areas of the ventricles after normalisation to negative control at each time point.
|
