FIGURE SUMMARY
Title

ZebraReg-a novel platform for discovering regulators of cardiac regeneration using zebrafish

Authors
Apolínová, K., Pérez, F.A., Dyballa, S., Coppe, B., Mercader Huber, N., Terriente, J., Di Donato, V.
Source
Full text @ Front Cell Dev Biol

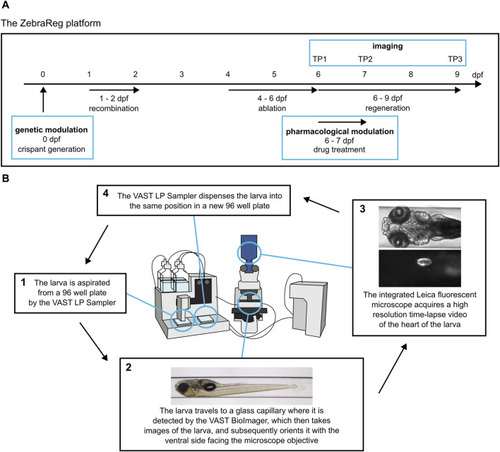
ZebraReg: a novel platform for discovering regulators of cardiac regeneration using zebrafish. (A) Overview of the timeline of the experimental procedure. The ZebraReg platform utilises the doubly transgenic Heartbreaker zebrafish line. In this zebrafish line, a tamoxifen-induced recombination and subsequent drug treatment lead to cell-specific death of a large pool of ventricular cardiomyocytes. Thus, a robust ventricular injury is caused, and is regenerated through the proliferation of the remaining cardiomyocytes. Automated imaging at six, seven and nine dpf (corresponding to timepoints TP1, TP2, and TP3) allows for the longitudinal analysis of the regenerative process. The process can be integrated with pharmacological and genetic approaches to determine the effect of genes and drugs on regeneration kinetics. In the case of pharmacological modulation, the drug treatment is performed for 24 h between TP1 and TP2. In the case of genetic modulation, a CRISPR/Cas9-based approach for generating F0 crispants is performed at one-cell stage to induce the loss of function of the gene of interest. (B) The automated imaging system consists of the VAST BioImager and LP Sampler and an integrated Leica fluorescent microscope for high resolution imaging. The systems cooperate in order to detect and image each larva. For each larva, two readouts are generated: firstly, a set of in toto images is obtained by the VAST BioImager for morphological readouts. The larva is then oriented with the ventral side facing the objective of the integrated fluorescent Leica microscope. Subsequently, the Leica microscope obtains a high-resolution time-lapse video of the heart. This video is then used to determine the size of the heart at each timepoint to determine the regeneration kinetics of each larva. The larva is then dispensed into a destination 96 well plate in the same position it was located in the source 96 well plate. Modified from Dyballa et al. (2019).

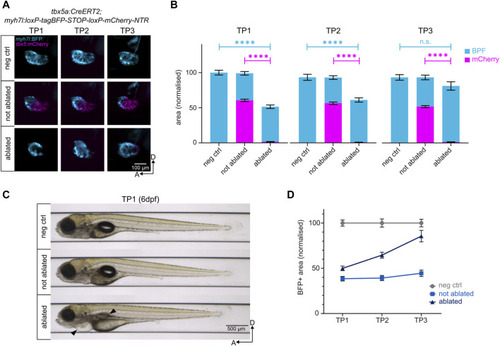
Genetic ablation of ventricular cardiomyocytes and subsequent regeneration. (A) Lateral view of the negative control, not ablated, and ablated ventricles. NTR-mCherry expressing cells undergo apoptosis in the ablated condition. The remaining BFP+ ventricular cardiomyocytes reconstruct the heart to levels comparable to the negative control by TP3. (B) Quantification of BFP+ and mCherry + areas of the ventricles after normalisation to negative control at each time point. At TP1, over 95% of NTR-mCherry expressing cells are ablated in the ablated condition. The BFP+ pool in ablated ventricles represents 45% of the BFP+ pool of the negative control ventricles. By TP3, it reaches approximately 85% of the BFP+ pool of the negative control ventricles. TP1: N = 35, 44, 42; TP2: N = 18, 39, 35; TP3: 14, 21, 19 for negative control, not ablated, and ablated larvae, respectively. (C) Automated imaging of negative control, not ablated, and ablated larvae at 6 dpf (TP1) through the VAST BioImager. Genetic cardiomyocyte ablation leads to the development of pericardial edema and swim bladder abnormality in ablated larvae (black arrows), consistent with a heart failure phenotype. (D) Regeneration kinetics graph. Representation of the BFP+ areas of the ventricles after normalisation to negative control at each time point.

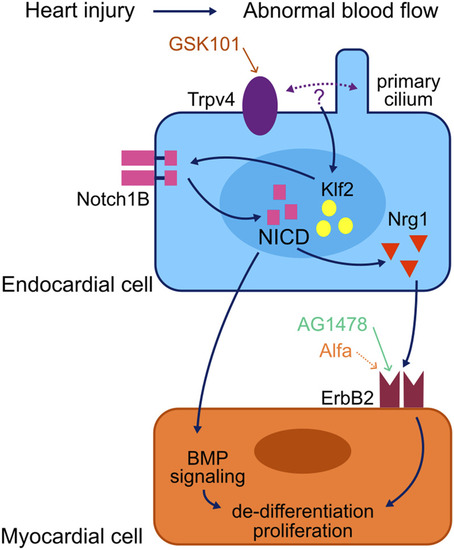
Model of a myocardial regeneration signalling network. Activation of the mechanosensory channel Trpv4 in the endocardium triggers a series of signalling events which lead to the activation of the ErbB2 channel in the myocardium and thus the initiation of regenerative processes in the injured myocardium. Adapted from Li et al. (2021).

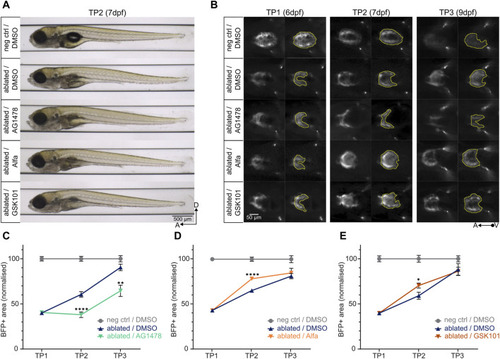
Determining the pro- and anti-regenerative effects of drugs on regeneration kinetics. (A) Larvae at TP2 after 24-h treatment with AG1478 (4.6 µM), Alfa (5 µM), or GSK101 (0.8 µM) do not show any significant developmental defects compared to the ablated control treated with 0.3% DMSO. (B) Representative images of ventral view of ventricles during systole (left) and BFP+ ventricular areas (right). At TP2, the treatment with AG1478 leads to a decrease in BFP+ ventricular area compared to ablated DMSO control; on the other hand, the treatment with Alfa and GSK101 leads to an increase. (C), (D), (E) Regeneration kinetics graphs after 24-h treatment with selected drugs between TP1 and TP2. Pro- and anti-regenerative effects of drugs can be assessed. For each condition, two separate experiments were performed, and values pooled after normalisation to corresponding negative control at each time point. (C) The treatment with AG1478 leads to a highly significant decrement in BFP+ area at both TP2 and TP3 compared to ablated DMSO control. TP1: N = 31, 31, 22; TP2: N = 24, 27, 22; TP3: N = 12, 16, 16 for negative DMSO control, ablated DMSO control, and AG1478 treated group, respectively. At TP2, p <0.0001; at TP3, p = 0.0012. (D) The treatment with Alfa leads to a highly significant increment in BFP + area at TP2 compared to ablated DMSO control. TP1: N = 32, 40, 29; TP2: N = 27, 29, 30; TP3: N = 12, 15, 16 for negative DMSO control, ablated DMSO control, and Alfa treated group, respectively. p <0.0001. (E) The treatment with GSK101 leads to a significant increment in BFP + area at TP2 compared to ablated DMSO control. TP1: N = 21, 35, 27; TP2: N = 17, 22, 20; TP3: N = 8, 11, 10 for negative DMSO control, ablated DMSO control, and GSK101 treated group, respectively. p = 0.0101.

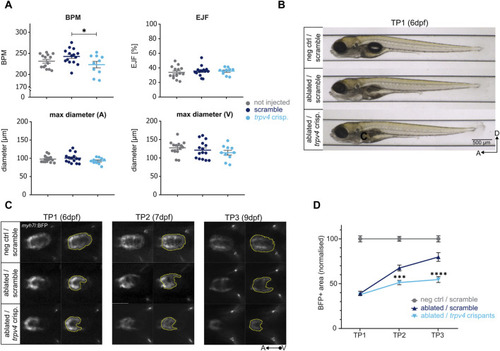
Determining the effect of genes on regeneration kinetics. The CRISPR/Cas9-driven loss of function of trpv4 leads to an impaired regeneration. (A) The loss of function of trpv4 does not lead to an overt cardiac development defect compared to non-injected and scramble-injected controls at 5dpf as seen in the following functional and morphological ZeCardio readouts: beats per minute (BPM), ejection fraction (EJF), and maximum diameter of the atrium (A) and ventricle (V). A significant reduction in BPM is observed compared to scramble control (p = 0.0456) but not non-injected control (p = 0.5635). N = 14, 15, 10 for not injected control, scramble control, and trpv4 crispants, respectively. (B) The loss of function of trpv4 does not lead to any overt developmental defects compared to scramble-injected ablated larvae at 6dpf (TP1). (C) Representative images of ventral view of ventricles during systole (left) and BFP + ventricular areas (right) at TP1, TP2, and TP3. The loss of function of trpv4 leads to a decrease in BFP+ ventricular area compared to scramble-injected ablated control at both TP2 and TP3. (D) Regeneration kinetics graph. The loss of function of trpv4 leads to a highly significant decrement in BFP+ area at both TP2 and TP3 compared to scramble-injected ablated control. Two separate experiments were performed, and values pooled after normalisation to corresponding negative control at each time point. TP1: N = 24, 27, 35; TP2: N = 16, 20, 31; TP3: N = 8, 18, 27 for negative scramble-injected control, ablated scramble-injected control, and ablated trpv4 crispants, respectively. At TP2, p = 0.0002; at TP3, p <0.0001.

Acknowledgments
This image is the copyrighted work of the attributed author or publisher, and ZFIN has permission only to display this image to its users. Additional permissions should be obtained from the applicable author or publisher of the image. Full text @ Front Cell Dev Biol