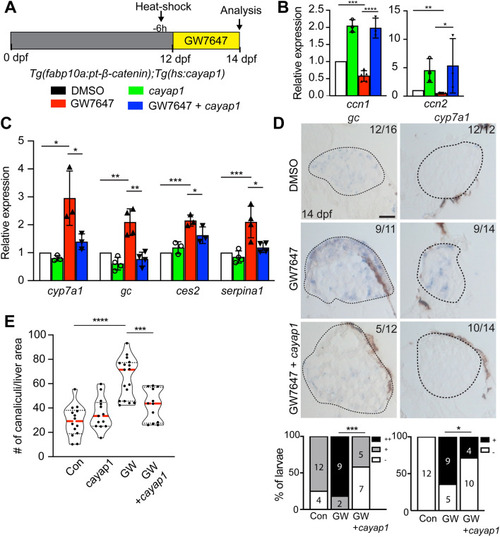
PPARα activation promotes LPC-to-hepatocyte differentiation by suppressing YAP signaling. (A) Scheme illustrating an experimental strategy for YAP overactivation. The Tg(hs:cayap1) line was used to enhance YAP signaling with a heat-shock 6 h before GW7647 treatment. (B, C) qRT-PCR data showing the relative expression levels of hepatocyte (cyp7a1, gc, serpina1, ces2) and BEC (her9, epcam) markers and YAP target genes (ccn1, ccn2) among the following four groups of 14-dpf Tg(fabp10a:pt-β-catenin) livers: (1) DMSO-treated control, (2) cayap1+, (3) GW7647-treated, and (4) GW7647-treated cayap1+. Data are represented as mean ± SD. (D) Section in situ hybridization images showing the expression of hepatocyte (cyp7a1, gc) and BEC (epcam) markers in 14-dpf Tg(fabp10a:pt-β-catenin) livers. For quantification, larvae were grouped into ++/+/− based on gene expression levels. Dashed lines outline the livers. Numbers in the upper right corner indicate the proportion of larvae exhibiting the phenotype shown. Scale bars, 50 μm. (E) Violin plot graphs showing the quantification of the number of Abcb11+ canaliculi per liver area; median and quartiles are indicated by red dashed and black dotted lines, respectively. ns not significant; *P < 0.05, **P < 0.01, ***P < 0.001, ****P < 0.0001; statistical significance was calculated using an unpaired two-tailed t-test (B, C, E), Fisher’s exact test (D; cyp7a1), and chi-square test (D; gc).
|
