
FIGURE
Figure 2
- ID
- ZDB-FIG-220430-103
- Publication
- Shih et al., 2022 - In Vivo Functional Assay in Fish Gills: Exploring Branchial Acid-Excreting Mechanisms in Zebrafish
- Other Figures
- All Figure Page
- Back to All Figure Page
Figure 2
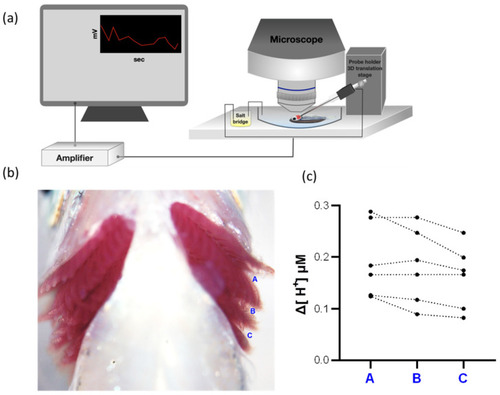
Figure 2. H+ activities at different positions in the gills. The diagram of the scanning ion-selective electrode technique (SIET) device is shown (a). Three measured positions (A, B, and C) between each gill arch are shown in (b). The H+ gradients at different positions of the gills were measured by the SIET (N = 6) (c). The dotted line represents the same fish.
|
Expression Data
Expression Detail
Antibody Labeling
Phenotype Data
Phenotype Detail
Acknowledgments
This image is the copyrighted work of the attributed author or publisher, and
ZFIN has permission only to display this image to its users.
Additional permissions should be obtained from the applicable author or publisher of the image.
Full text @ Int. J. Mol. Sci.