
Image
|
Figure Caption
Figure 2
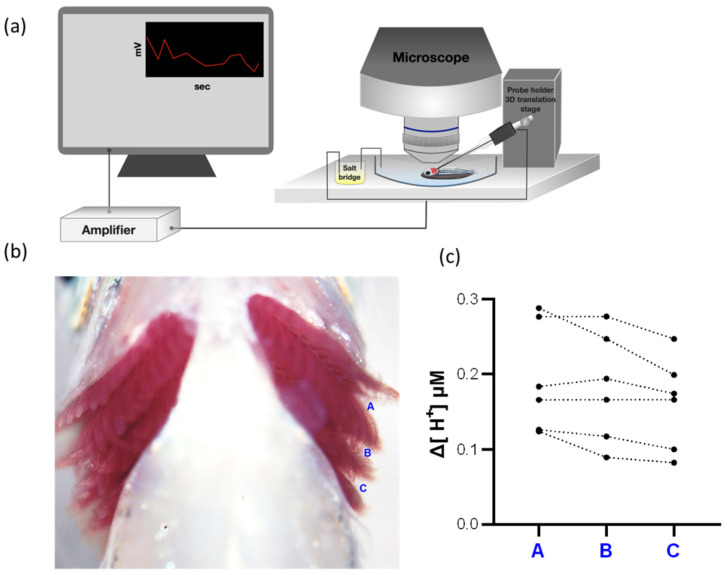
Figure 2. H+ activities at different positions in the gills. The diagram of the scanning ion-selective electrode technique (SIET) device is shown (a). Three measured positions (A, B, and C) between each gill arch are shown in (b). The H+ gradients at different positions of the gills were measured by the SIET (N = 6) (c). The dotted line represents the same fish.
Acknowledgments
This image is the copyrighted work of the attributed author or publisher, and
ZFIN has permission only to display this image to its users.
Additional permissions should be obtained from the applicable author or publisher of the image.
Full text @ Int. J. Mol. Sci.