
FIGURE
Figure 3
- ID
- ZDB-FIG-220430-104
- Publication
- Shih et al., 2022 - In Vivo Functional Assay in Fish Gills: Exploring Branchial Acid-Excreting Mechanisms in Zebrafish
- Other Figures
- All Figure Page
- Back to All Figure Page
Figure 3
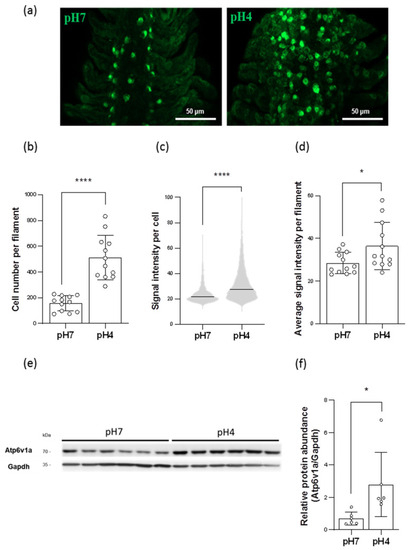
Figure 3. Effects of acid acclimation on the number of HR ionocytes and the expression of HA in the gills. The number of HR ionocytes and the fluorescence intensity of Atp6v1a signals in the gills were analyzed by immunofluorescence (IF) after acid acclimation (a). HR ionocyte number of filaments (N = 12) (b), mean fluorescence intensity of individual HR ionocytes (N = 1894–6144) (c), and average mean fluorescence intensity of HR ionocytes of filaments (N = 12) (d) were presented. The protein expression of HA in the gills acclimated to acid environments was analyzed by Western blot. The blots showed the bands with molecular weights corresponding to Atp6v1a and Gapdh (approximately 70 kDa and 35 kDa, respectively) (e). The protein expression of HA was quantified and normalized to Gapdh (N = 6) (f). Values are the mean ± SD or SEM. Student’s t-test or Mann–Whitney U test, * p < 0.05, **** p < 0.0001.
|
Expression Data
Expression Detail
Antibody Labeling
Phenotype Data
Phenotype Detail
Acknowledgments
This image is the copyrighted work of the attributed author or publisher, and
ZFIN has permission only to display this image to its users.
Additional permissions should be obtained from the applicable author or publisher of the image.
Full text @ Int. J. Mol. Sci.