
Figure 4
- ID
- ZDB-FIG-210725-113
- Publication
- Jeong et al., 2021 - Optogenetic Manipulation of Olfactory Responses in Transgenic Zebrafish: A Neurobiological and Behavioral Study
- Other Figures
- All Figure Page
- Back to All Figure Page
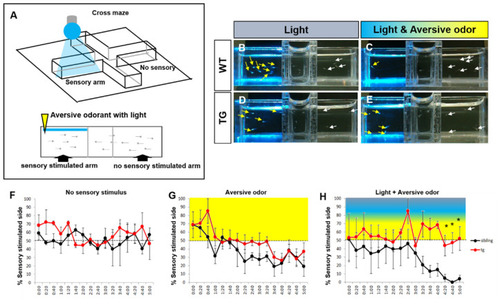
Light and odorant-driven behavior in transgenic zebrafish. (A) Schematic diagram of the conflicting sensory cues-based behavioral test. In a cross-shaped maze, blue light illumination and odorant treatment was performed. The light and the odor cue were both presented in the same (left) arm. (B–E) Images of zebrafish in the behavioral apparatus. The control sibling fish swam toward the blue light illuminated site (B), but when the light was co-presented with the aversive odor cue, they swam away from the stimulus presentation arm (C). The transgenic fish showed no avoidance behavior when the blue light and aversive odor were co-presented (E). Yellow arrows indicate the zebrafish larvae in the stimulus arm; white arrows depict the zebrafish in the no stimulus arm. (F–H) Behavioral response to blue light and aversive odor was measured by the percent of larvae counted in stimulus arm of the cross-shaped maze over time (20 fishes). (F) No sensory stimulus. (G) The aversive odor alone. (H) Blue light and aversive odor co-presented. Dotted lines indicate 50 % of the number of fish in the stimulus arm (chance level performance). All values represent mean ± S.E.M. * p < 0.05. p value was determined by Student’s t test. n = 3 clutches from three independent experiments. |