
Figure 2
- ID
- ZDB-FIG-210725-111
- Publication
- Jeong et al., 2021 - Optogenetic Manipulation of Olfactory Responses in Transgenic Zebrafish: A Neurobiological and Behavioral Study
- Other Figures
- All Figure Page
- Back to All Figure Page
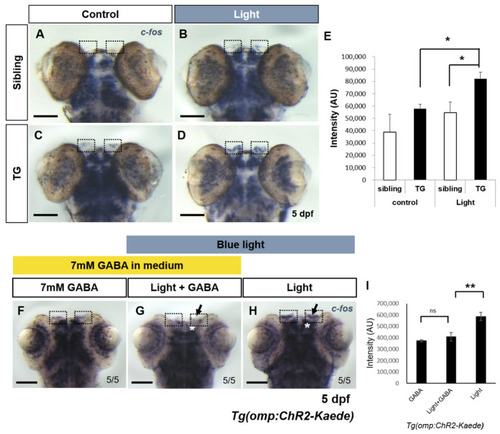
Expression analysis of c-fos for evaluating light-induced neuronal activity in transgenic fish. (A–D) Whole-mount in situ hybridization of c-fos in the transgenic fish and non-transgenic siblings at 5 dpf. (A) Control non-transgenic fish. (B) Light-irradiated non-transgenic fish. (C) Control transgenic fish. (D) Light-irradiated transgenic fish. Dotted boxes indicate olfactory epithelium of 5 dpf zebrafish. In light-irradiated transgenic fish, c-fos expression was ectopically induced at the olfactory epithelium (D). (E) Quantitative analysis of c-fos expression in olfactory epithelium. Intensity of c-fos transcripts in olfactory epithelium (dotted boxes) was measured by Image J. n = 4 for control sibling; n = 4 for control TG; n = 4 for light-irradiated sibling; and n = 5 for light-irradiated TG. (Tg light vs. Tg control, p = 0.0095; Tg light vs. sibling light, p = 0.04181). (F–H) Suppression of light-evoked odor response by GABA application in transgenic fish expressing ChR2 in the olfactory sensory neurons. (F) 7mM GABA treated control transgenic zebrafish at 5 dpf. (G) Optically stimulated transgenic zebrafish with GABA. (H) Light-irradiated transgenic zebrafish. Black arrow indicates olfactory epithelium and asterisk marked olfactory bulb. (I) Intensity of c-fos expression in olfactory epithelium upon GABA treatment. n = 5 for each experiment. (Tg light vs. Tg light + GABA, p = 0.005). All values are represented as mean ± S.E.M; * p < 0.05 and ** p < 0.005. p value was determined by unpaired t test. ns, not significant. Scale bars: 100 μm. |