
FIGURE
Fig. 3
- ID
- ZDB-FIG-140804-16
- Publication
- Forn-Cuní et al., 2014 - The Evolution and Appearance of C3 Duplications in Fish Originate an Exclusive Teleost c3 Gene Form with Anti-Inflammatory Activity
- Other Figures
- All Figure Page
- Back to All Figure Page
Fig. 3
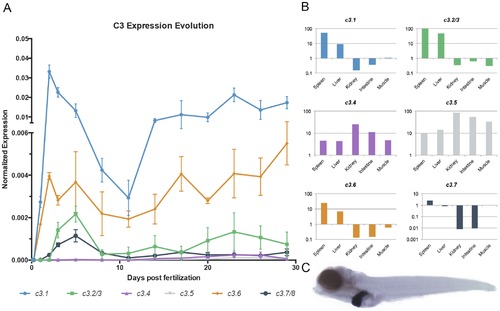
c3 expression during development. (A) c3 expression was evaluated in zebrafish larvae over time. c3 expression values were normalized against the expression of elongation factor 1-α. The graph depicts the mean results from 3 different experiments, each using a pool of 10–15 (3 hpf to 14 dpf) or 6–8 (17 dpf to 29 dpf) animals. (B) c3 expression relationships between the adult and larval stages. c3 expression values from adult individuals were divided by the mean values obtained during larval ontogeny. (C). In situ hybridization of a 5 dpf zebrafish larvae showing primary c3.1 expression in the liver. |
Expression Data
| Genes: | |
|---|---|
| Fish: | |
| Anatomical Terms: | |
| Stage Range: | Prim-5 to Days 30-44 |
Expression Detail
Antibody Labeling
Phenotype Data
Phenotype Detail
Acknowledgments
This image is the copyrighted work of the attributed author or publisher, and
ZFIN has permission only to display this image to its users.
Additional permissions should be obtained from the applicable author or publisher of the image.
Full text @ PLoS One