FIGURE SUMMARY
Title

Galangin ameliorates PTU-induced vitiligo in zebrafish and B16F10 cells by increasing melanogenesis through activation of the p38/JNK MAPK pathway

Authors
Wusiman, Z., Zhang, A.M., Zhang, S.S., Zhao, P.P., Kang, Y.T., Zhang, Y., Li, Z.J., Huo, S.X.
Source
Full text @ Front Pharmacol

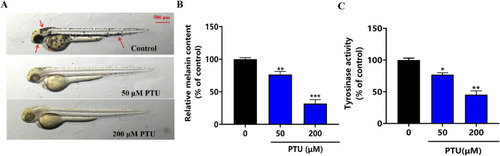
PTU-induced zebrafish depigmentation model. (A) the phenotype of the depigmentation model constructed by PTU (n = 10, size: 500 μM). (B) Histogram of melanin content, and (C) the histogram of tyrosinase activity (n = 10).

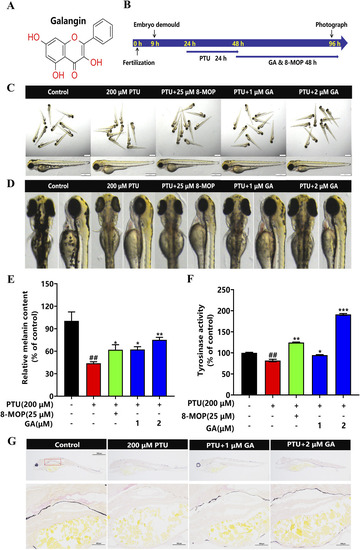
Effect of GA on melanin synthesis and TYR activity of zebrafish. (A) Chemical structure of GA. (B) The nine hpf zebrafish embryos were demembrane with strepsin E, then 200 μM PTU was added to the zebrafish embryos at 24 hpf for 24 h, and GA at different concentrations (1 and 2 μM) was added to the zebrafish embryos for 48 h. (C) The overall morphology of Zebrafish (n = 10, size:1 mm, 500 μm). (D) Morphological plots of the back and side of the zebrafish. (E) Relative melanin content and Relative tyrosinase activity (F) were calculated by normalizing with the control group (n = 10). (G) Fontana-masson staining (n = 10, size: 100 μm).

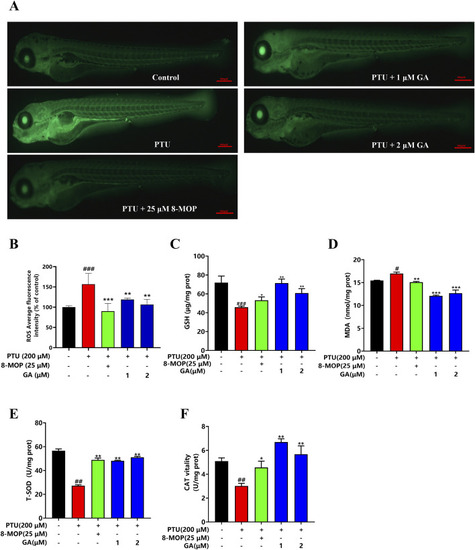
Effects of GA on content of ROS and oxidation indexes in zebrafish. (A) Zebrafish ROS fluorogram (n = 10, size: 500 μm). (B) ROS content in zebrafish. (C–F) GSH, MDA, T-SOD, CAT content measurement (n = 10).

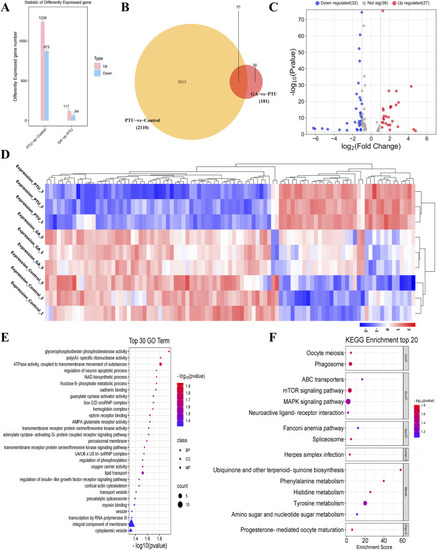
Analysis of differentially expressed genes (n = 3).
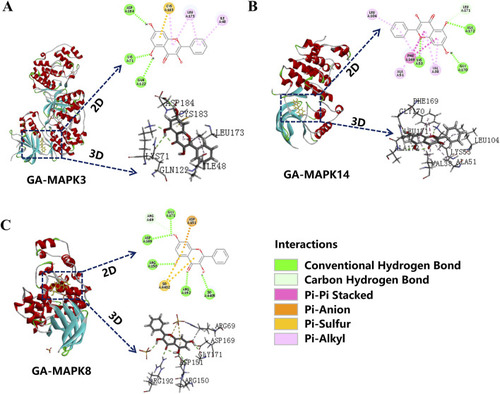
 (A) histogram of differentially expressed genes. (B) Venn diagram of differentially expressed genes. (C) Volcano plots of differentially expressed genes. (D) Cluster analysis of differentially expressed genes. (E) Gene Ontology (GO) functional enrichment analysis, biological processes (BP), cellular components (CC) and molecular functions (MF). (F) KEGG pathway enrichment analysis.

Molecular docking. (A) MAPK8; (B) MAPK14; (C) MAPK3 molecular docking with GA.

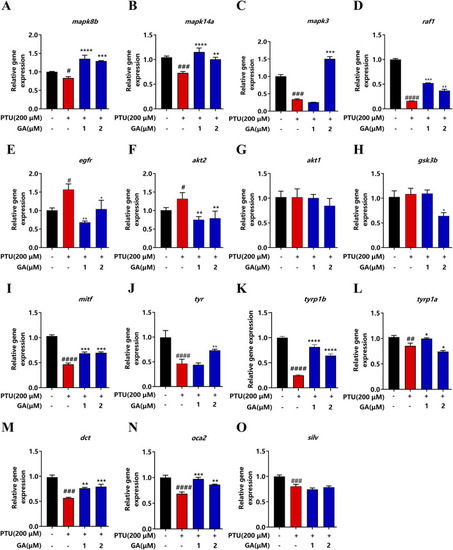
Effect of GA on expression levels of depigmentation-related genes in zebrafish (n = 10). (A) mapk8b; (B) mapk14a; (C) mapk3; (D) raf1; (E) egfr; (F) akt2; (G) akt1; (H) gsk3b; (I) mitf; (J) tyr; (K) tyrp1b; (L) tyrp1a; (M) dct; (N) oca2; (O) silv.

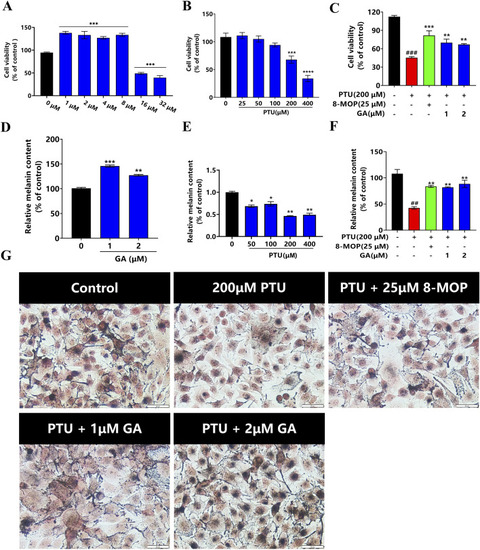
Protective effect of GA on B16F10 cells in vitro (n = 6). (A) B16F10 cells were incubated with GA at various concentrations for 24 h. (B) B16F10 cells were incubated with PTU at various concentrations for 24 h, and the cell viability was examined by CCK-8 assay. (C) Protective effect of GA on PTU-induced B16F10 cell damage. (D) After B16F10 cells were treated with different concentrations of GA and PTU for 24 h, the content of melanin was detected as GA and PTU (E). (F) Protective effect of GA on PTU-induced melanin synthesis. (G) Fontana-masson staining of B16F10 cells (size:50 μM).

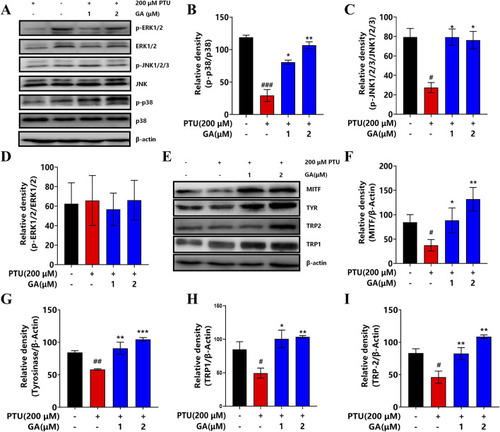
Effect of GA on the expression of key signaling pathway proteins. (A) Western blotting to detect the expression levels of p38 MAPK, ERK and JNK. (B–D) Effect of GA on the expression of p38, JNK1/2/3 and ERK1/2 proteins in B16F10 cells (n = 3). (E) Western blotting to detect the expression levels of MITF, TYR, TRP2 and TRP1. (F–I) Effect of GA on MITF, TYR, TRP2 and TRP1 protein expression in B16F10 cells (n = 3).

Acknowledgments
This image is the copyrighted work of the attributed author or publisher, and ZFIN has permission only to display this image to its users. Additional permissions should be obtained from the applicable author or publisher of the image. Full text @ Front Pharmacol