IMAGE

FIGURE 2

ID
ZDB-IMAGE-250325-27
Source
Figures for Wusiman et al., 2025
Image
Figure Caption

FIGURE 2

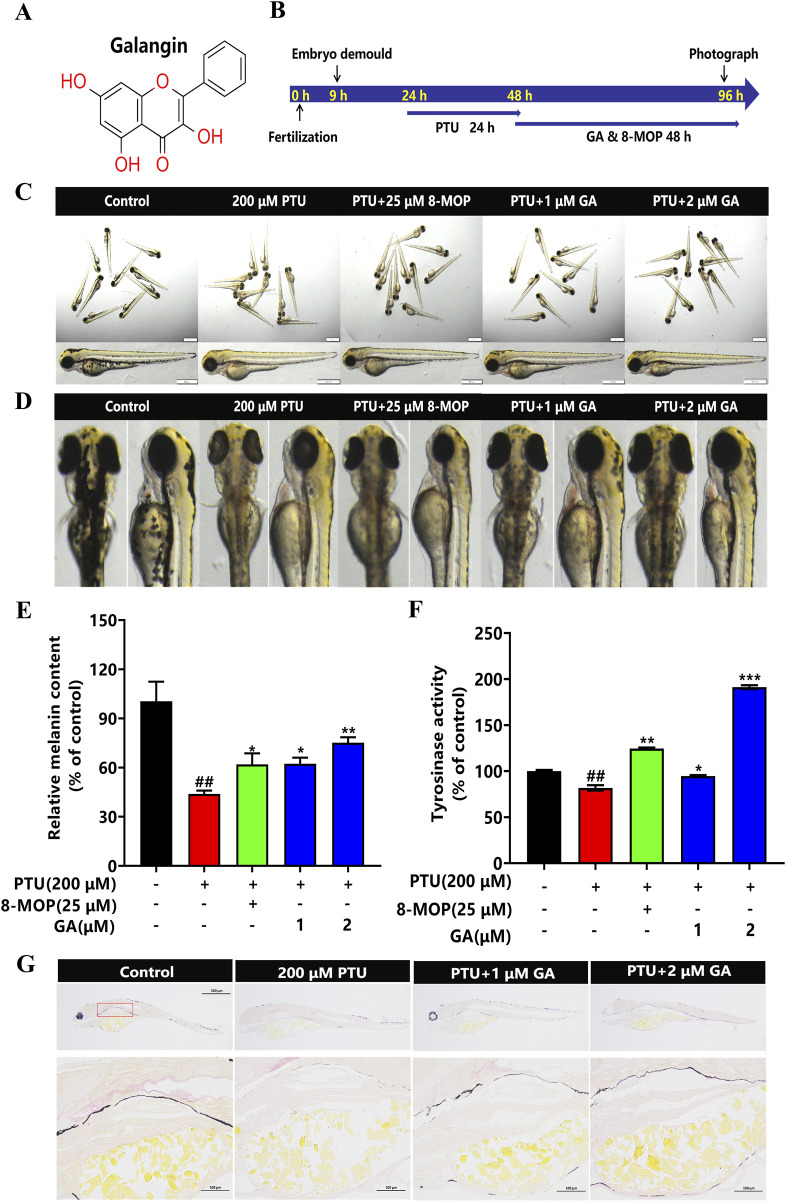
Effect of GA on melanin synthesis and TYR activity of zebrafish. (A) Chemical structure of GA. (B) The nine hpf zebrafish embryos were demembrane with strepsin E, then 200 μM PTU was added to the zebrafish embryos at 24 hpf for 24 h, and GA at different concentrations (1 and 2 μM) was added to the zebrafish embryos for 48 h. (C) The overall morphology of Zebrafish (n = 10, size:1 mm, 500 μm). (D) Morphological plots of the back and side of the zebrafish. (E) Relative melanin content and Relative tyrosinase activity (F) were calculated by normalizing with the control group (n = 10). (G) Fontana-masson staining (n = 10, size: 100 μm).

Acknowledgments
This image is the copyrighted work of the attributed author or publisher, and ZFIN has permission only to display this image to its users. Additional permissions should be obtained from the applicable author or publisher of the image. Full text @ Front Pharmacol