
FIGURE
FIGURE 4
- ID
- ZDB-FIG-250325-31
- Publication
- Wusiman et al., 2025 - Galangin ameliorates PTU-induced vitiligo in zebrafish and B16F10 cells by increasing melanogenesis through activation of the p38/JNK MAPK pathway
- Other Figures
- All Figure Page
- Back to All Figure Page
FIGURE 4
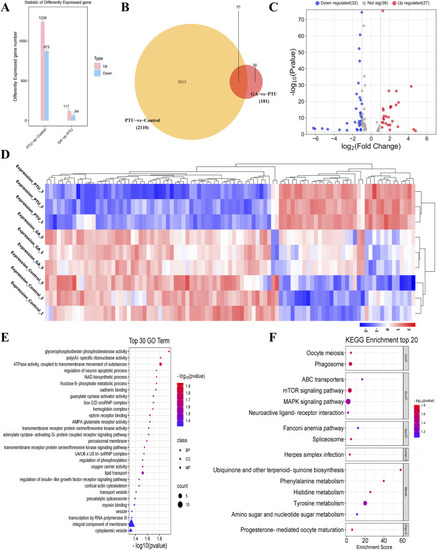
Analysis of differentially expressed genes (n = 3). |
Expression Data
Expression Detail
Antibody Labeling
Phenotype Data
Phenotype Detail
Acknowledgments
This image is the copyrighted work of the attributed author or publisher, and
ZFIN has permission only to display this image to its users.
Additional permissions should be obtained from the applicable author or publisher of the image.
Full text @ Front Pharmacol