
- Title
-
A zebrafish model of crim1 loss of function has small and misshapen lenses with dysregulated clic4 and fgf1b expression
- Authors
- Le, T., Htun, S., Pandey, M.K., Sun, Y., Magnusen, A.F., Ullah, E., Lauzon, J., Beres, S., Lee, C., Guan, B., Hufnagel, R.B., Brooks, B.P., Baranzini, S.E., Slavotinek, A.
- Source
- Full text @ Front Cell Dev Biol
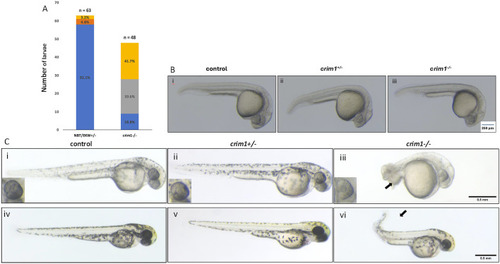
Morphology and appearance of control, heterozygous, PHENOTYPE:
|
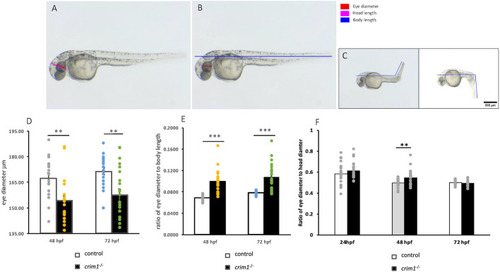
Eye, head, and body measurements from control and PHENOTYPE:
|
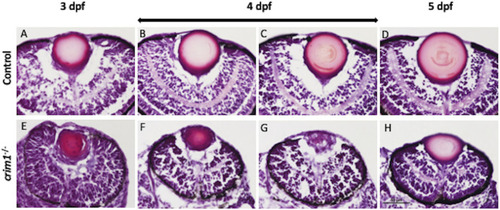
Representative images of zebrafish eyes stained with H&E from control and PHENOTYPE:
|
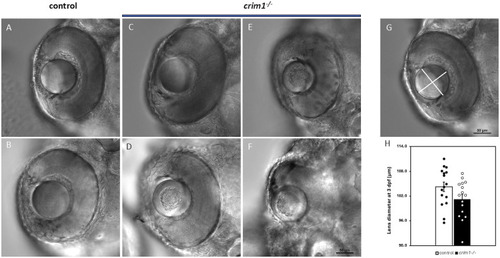
DIC microscopy of control and PHENOTYPE:
|
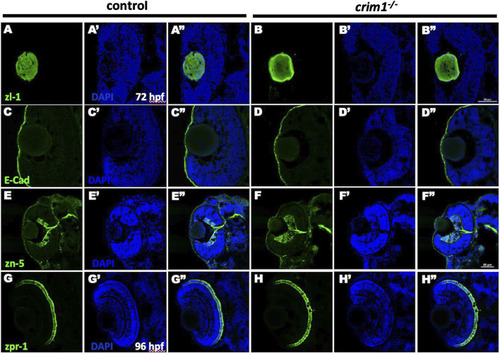
Immunohistochemistry in control and PHENOTYPE:
|
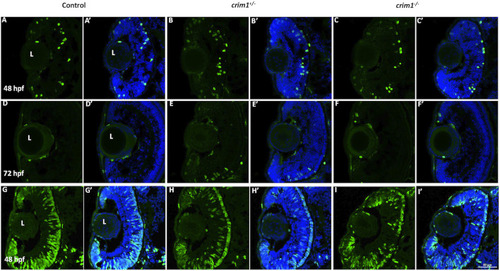
Phospho-histone H3 and 5-bromo-2′-deoxyuridine staining in control, PHENOTYPE:
|
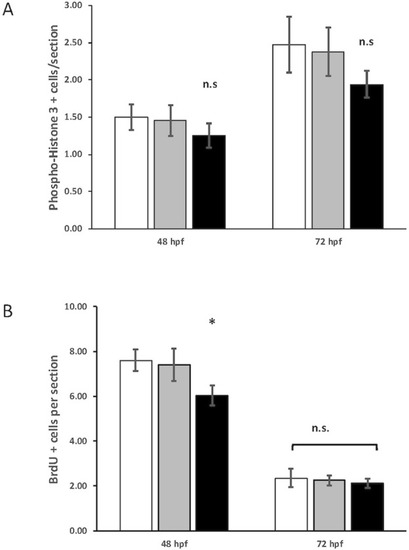
Quantification of phospho-histone H3 and 5-bromo-2′-deoxyuridine (BrdU) staining in control, heterozygous PHENOTYPE:
|
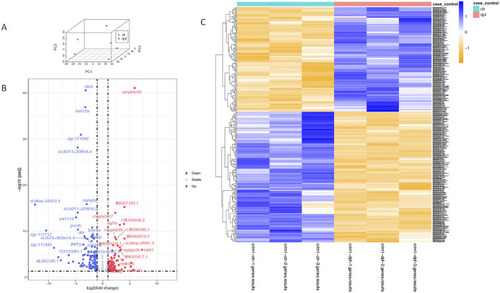
Principal component analysis, heatmap, and volcano plot showing DEGs for controls and |
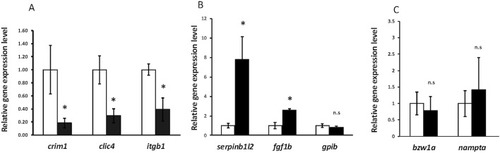
RT-qPCR showing significant downregulation of EXPRESSION / LABELING:
PHENOTYPE:
|
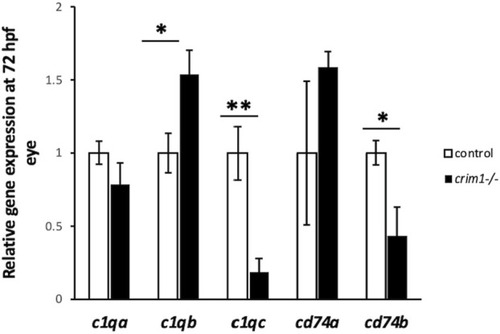
EXPRESSION / LABELING:
PHENOTYPE:
|