FIGURE SUMMARY
Title

The USH3A causative gene clarin1 functions in Müller glia to maintain retinal photoreceptors

Authors
Nonarath, H.J.T., Simpson, S.L., Slobodianuk, T.L., Tran, H., Collery, R.F., Dinculescu, A., Link, B.A.
Source
Full text @ PLoS Genet.

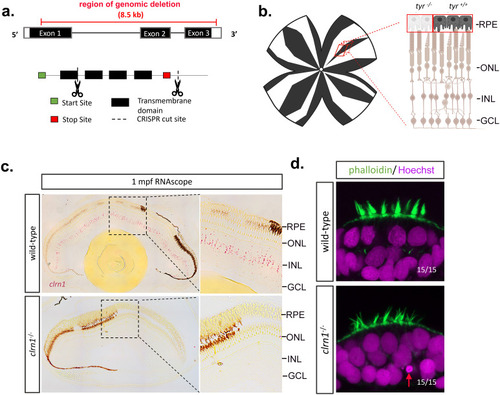
Development of USH3A zebrafish model.

CRISPR/Cas9 technology was used to generate a large deletion within the clrn1 gene and establish a germ-line transmitting mutant line. Pairs of CRISPR gRNAs were designed to target Exon 1 and the 3’ UTR of clrn1. (a) Depiction of CRISPR cut sites in relation to clrn1 zebrafish exons and protein functional domains. (b) Method to mosaically mutate the tyrosinase gene and deplete pigmentation from the retinal pigment epithelium to allow for RNAscope probe detection. (c) Detection of clrn1 transcripts (bright red dots) in the inner retina of 1 mpf wild-type zebrafish using the highly sensitive RNAscope in-situ hybridization assay. Retinal Pigment Epithelium (RPE), Outer Nuclear Layer (ONL), Inner Nuclear Layer (INL), and Ganglion Cell Layer (GCL) are labeled in (b) and (c). (d) Phalloidin (actin, green) and Hoechst (nuclei, magenta) staining on 7dfp wild-type and clrn1-/- larvae to assess inner ear hair cell structure. Red arrow indicates pycnotic nuclei. n=15/15 embryos showing normal stereocilia in wild-type and 15/15 embryos showing splayed sterocilia in clrn1-/- mutants. Schematic in (b) created in BioRender under License: https://BioRender.com/c00b794.

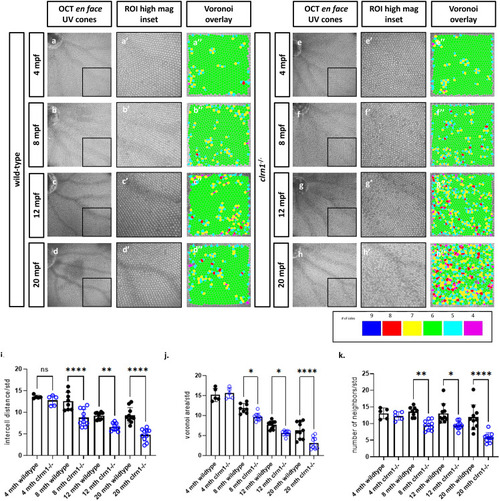
clrn1-/- zebrafish present with an altered UV cone mosaic beginning at 8 mpf.

En face images of the UV cone mosaic were segmented from OCT scans, a higher magnification ventro-temporal region of interest (ROI) was selected (a’-h’) and processed for Voronoi overlay analysis (a”-h”) in wild-type at (a) 4, (b) 8, (c) 12, and (d) 24 mpf, as well as clrn1-/- zebrafish at (e) 4, (f) 8, (g) 12, and (h) 24 mpf. Quantification of the UV cone mosaic regularity revealed statistically significant differences in (i) intercell distance regularity, (j) number of neighbors regularity and, (k) the Voronoi area regularity at 8 mpf in clrn1-/- zebrafish compared to wild-type. (*p<0.05, **p<0.01, ****p<0.001; Two-way ANOVA).

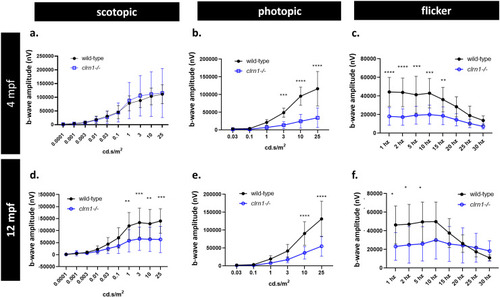
Scotopic and photopic ERG responses are affected by the loss of Clrn1.

Quantification of 4 mpf wild-type and clrn1-/- ERG b-wave amplitudes for (a) scotopic, (b) photopic, and (c) flicker responses. Quantification of 12 mpf wild-type and clrn1-/- ERG b-wave amplitudes for (d) scotopic, (e) photopic, and (f) flicker responses. (**p<0.01, ***p<0.005, ****p<0.001; One-way ANOVA). Error bars=SD. n=10 animals/eyes for each genotype per time-point.

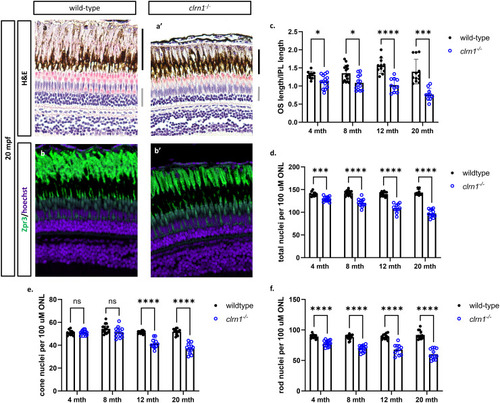
clrn1-/- zebrafish present with age-dependent shortening of the rod outer segments and thinning of the outer nuclear layer.

Hematoxylin and eosin-stained paraffin section from (a) 20 mpf wild-type and (a’) clrn1-/- zebrafish. Staining for Zpr3+ (Rhodopsin and green opsin), primarily marking rod photoreceptor outer segments (green) on paraffin sections from (b) 20 mpf wild-type and (b’) clrn1-/- zebrafish. (c) Quantification of rod outer segments (OS) length at 4, 8, 12, and 20 mpf. (d) Quantification of total photoreceptors per 100 µm of ONL length at 4, 8, 12, and 20 mpf. Analysis of (e) rod and (f) cone photoreceptors in wild-type and clrn1-/- zebrafish at 4, 8, 12, and 20 mpf. (a-b’) The black bars in (a’) denote the location of the rod OS, and the grey bar notes the outer nuclear layer. (ns, not significant = p>0.05, *p<0.05, **p<0.01, ***p<0.005, ****p<0.001; One-way ANOVA). (n=12-15 for each genotype per time-point).

High-intensity light induces rod and cone cell death in clrn1-/- zebrafish.

(a) Overview of light stress assay: larvae were treated with 3500 lux for 48 hours from 5-7 dpf. (b) Representative images of TUNEL-positive photoreceptors (white arrows) on cryosectioned retina from 7 dpf wild-type (upper panels) and clrn1-/- (lower panels) zebrafish revealed a significant increase in the (c) average number of pyknotic nuclei and (d) TUNEL-positive cells per section in the ONL of clrn1-/- zebrafish. (e) Retinal sections from 7dpf control or light-stressed wild-type (upper panels) and clrn1-/- zebrafish (lower panels) stained with wheat germ agglutinin (WGA, rods, green) and peanut agglutinin (PNA, cones, red) as well as Hoechst to label nuclei (white arrow heads denote pyknotic cells). Quantification of (f) WGA- and (g) PNA-positive outer segments along a 100 µm region of the peripheral retina revealed a significant decrease in rod and cone outer segments in control clrn1-/- zebrafish, which was exacerbated under light stress. Quantification of (h) WGA- and (i) PNA-positive outer segments along a 100 µm section of the central retina revealed a significant decrease in rod and cone outer segments in light-damaged clrn1-/- zebrafish. (*p<0.05, **p<0.01, ****p<0.001; Two-way ANOVA). Error bars=SD. Scale Bar = 100 µm. n=10-15 per genotype for each condition. OS, Outer Segment; ONL, Outer Nuclear Layer; INL, Inner Nuclear Layer. Schematic in (a) created in BioRender under License: https://BioRender.com/k07v149.

Actin is disorganized in the outer retina of clrn1-/- mutant zebrafish.

Transverse sections from 7 dpf wild-type and clrn1-/- Tg(gfap:GFP) zebrafish (a) showing the ordered spacing and radial expansion of Müller glia of both wild-type and clrn1 mutant retina. (b) Higher magnification images of Müller glia apical projections of wild-type and clrn1-/- zebrafish highlights disorganization of the mutant apical microvilli (c). Quantification of total Müller glia (MG) apical microvilli within a 40 µm2 region of the central retina of wildtype and clrn1-/- zebrafish (d). Müller glia (MG) apical microvilli length beyond the OLM (labeled with asterisk in b.) for wild-type and clrn1-/- 7 dpf zebrafish. (***p<0.005,****p<0.001; Students T-test). Scale bars = (a) 100 µm; (b) 50 µm. Data points in (c,d) represent measurements from n = 10 zebrafish each condition. For (d) data points are an average per zebrafish in which 9-22 projections quantified. Schematic in (b) created in BioRender under License: https://BioRender.com/x12n534.

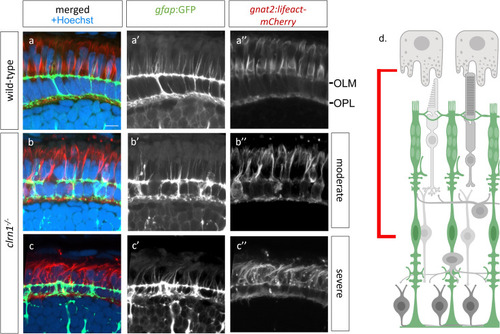
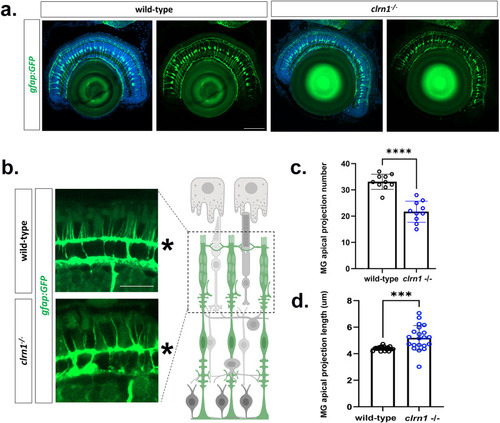
Apical processes of Müller glia and calyceal processes of cone photoreceptors are disorganized in clrn1-/- retina.

Transverse sections from 7 dpf (a) wild-type and (b,c) clrn1-/- mutant zebrafish each expressing the Tg(gfap:GFP); Tg(gnat2:Lifeact-mCherry) transgenes highlighting either (b) moderately or (c) more severely altered Müller glia apical microvilli projections (b’,c’) and cone-specific actin structures (b,” c”) in clrn1-/- mutants. (d) Cartoon showing the area imaged (red bar). Scale bar = 10 µm. OLM, Outer limiting membrane; OPL, Outer plexiform layer. Schematic in (d) created in BioRender under License: https://BioRender.com/x12n534.

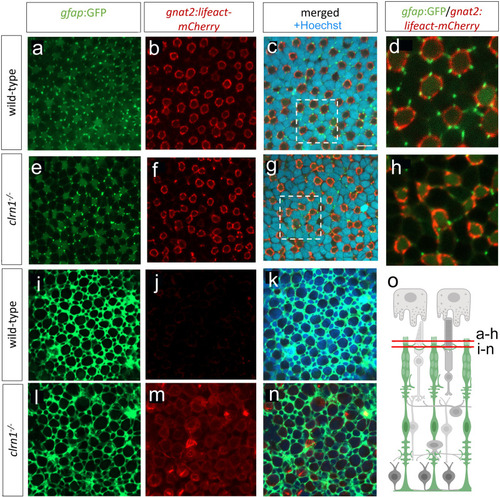
Interactions between Müller glia and cone photoreceptor cells are disorganized in
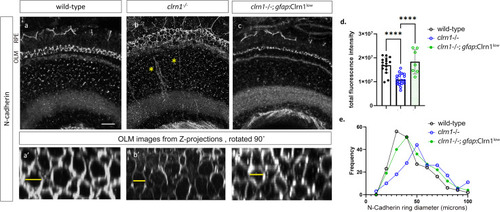
 clrn1-/-zebrafish.

En face images from Tg(gfap:GFP); Tg(gnat2:Lifeact-mCherry) 7 dpf transgenic zebrafish at the level of UV cone outer segments in either (a-d) wild-type or (e-h) clrn1-/- retina. Comparison of higher magnification images of (d) wild-type versus (h) clrn1-/- highlight abnormal interactions between Müller glia apical processes and cone calyceal processes within mutants. (i-n) En face images from Tg(gfap:GFP); Tg(gnat2:Lifeact-mCherry) 7 dpf transgenic zebrafish at the level of the OLM just apical of the adherens junctions, Müller glia processes encircle photoreceptors. Comparison of (i) wild-type versus (l) clrn1-/- highlight disorganization in mutants. At this image plane, actin is not well detected in (j) wild-types, but accumulates in (m) clrn1-/- cone photoreceptors. (o) Cartoon showing the imaged planes. Scale bar (c) = 5 µm. Schematic in (o) created in BioRender under License: https://BioRender.com/x12n534.

Expression of N-cadherin is reduced in clrn1-/- zebrafish.

Confocal microscope images of N-cadherin immunostaining in transverse cryosections of retinas from 7 dpf (a) wild-type, (b) clrn1-/-, and (c) clrn1-/-Tg(gfap:Clrn1low). Images of N-cadherin staining in the OLM (a’, b’, c’) were generated by rotating projected Z-stacks 90˚at the level of the OLM. The OLM and RPE are denoted to the left of panel (a). Yellow asterisks in (b) indicate delocalized N-cadherin within the inner nuclear layer. (d) Quantitation of N-cadherin fluorescence intensity from 300 um2 central retinal regions revealed that N-cadherin staining was reduced in clrn1-/- but not in clrn1-/-; gfap:Clrn1low (n=12 eyes each genotype). (e) N-Cadherin ring diameter frequency distribution for each genotype. Example measurements marked by yellow lines. Date points in (e) represent 35 rings scored in 300 um2 central retina region (n = 12 eyes each genotype). (****p<0.001; One-way ANOVA). Error bars=SD. Scale Bar=10 mm.

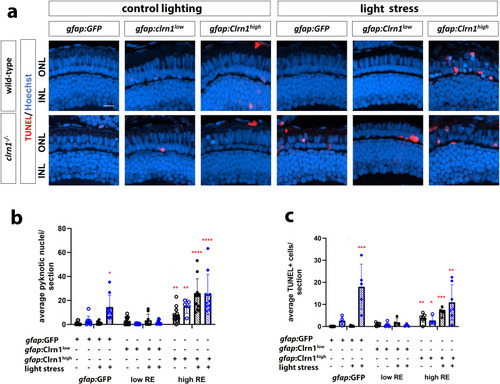
Therapeutic efficacy of Clrn1 re-expression in Müller glia depends on expression level.

(a) Retinal images of 7 dpf wild-type (upper rows) and clrn1-/- mutant (lower rows) zebrafish expressing different transgenes (column labels) raised in control lighting conditions (right) or treated from 5-7 dpf with 3500 lux for 48 hours (left, light stress). Hoechst (blue) highlights nuclei of the outer (photoreceptor layer) and inner nuclear layers (labeled ONL and INL) while TUNEL staining (red) highlights dying cells. Quantitation of (b) pyknotic nuclei or (c) TUNEL-positive cells in the ONL reveals that the gfap:Clrn1low transgene decreases sensitivity to light stress induced cell death in clrn1-/- zebrafish while the gfap:Clrn1high transgene induced cell death in clrn1-/- and wild-type zebrafish. (*p<0.05, **p<0.01, ***p<0.005, ****p<0.001; Two-way ANOVA; Significance shown compared to wild-type gfap:GFP without light stress). Error bars=SD. Scale Bar = 50 µm. n=8-12 larvae for each genotype per condition.

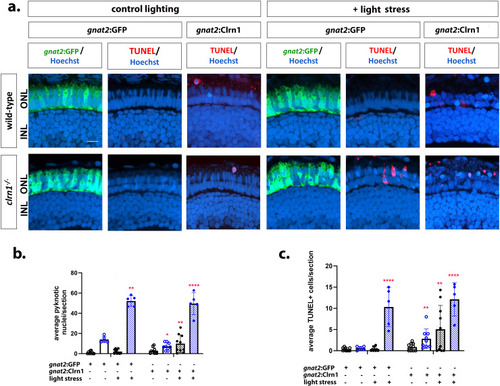
Re-expression of Clrn1 in cone photoreceptors does not reduce sensitive to light stress.

(a) Retinal images of 7 dpf wild-type (upper rows) and clrn1-/- mutant (lower rows) zebrafish expressing either gnat2:GFP or gnat2:Clrn1 transgenes (column labels) raised in control lighting conditions (right) or treated from 5-7 dpf with 3500 lux for 48 hours (left, light stress). Hoechst (blue) highlights nuclei of the outer (photoreceptor layer) and inner nuclear layers (labeled ONL and INL) while TUNEL staining (red) highlights dying cells. Quantitation of (b) pyknotic nuclei or (c) TUNEL-positive cells in the ONL reveals that re-expression of Clrn1 in cone photoreceptors does not protect clrn1-/- mutants from light stress induced cell death. (*p<0.05, **p<0.01, ***p<0.005, ****p<0.001; Two-way ANOVA; Significance shown compared to wild-type gnat2:GFP without light stress). Error bars=SD. Scale Bar = 50 µm. n=5-10 larvae for each genotype per condition.

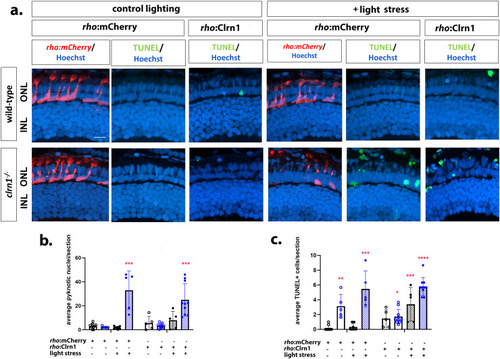
Re-expression of Clrn1 in rod photoreceptors does not reduce sensitive to light stress.

(a) Retinal images of 7 dpf wild-type (upper rows) and clrn1-/- mutant (lower rows) zebrafish expressing either rho:GFP or rho:Clrn1 transgenes (column labels) raised in control lighting conditions (right) or treated from 5-7 dpf with 3500 lux for 48 hours (left, light stress). Hoechst (blue) highlights nuclei of the outer (photoreceptor layer) and inner nuclear layers (labeled ONL and INL) while TUNEL staining (red) highlights dying cells. Quantitation of (b) pyknotic nuclei or (c) TUNEL-positive cells in the ONL reveals that re-expression of Clrn1 in rod photoreceptors does not protect clrn1-/- mutants from light stress induced cell death. (*p<0.05, **p<0.01, ***p<0.005, ****p<0.001; Two-way ANOVA; Significance shown compared to wild-type rho:GFP without light stress). Error bars=SD. Scale Bar = 50 µm. n=5-10 larvae for each genotype per condition.

Acknowledgments
This image is the copyrighted work of the attributed author or publisher, and ZFIN has permission only to display this image to its users. Additional permissions should be obtained from the applicable author or publisher of the image. Full text @ PLoS Genet.