
- Title
-
NDUFB7 mutations cause brain neuronal defects, lactic acidosis, and mitochondrial dysfunction in humans and zebrafish
- Authors
- Chen, Y.L., Chung, B.H., Mimaki, M., Uchino, S., Chien, Y.H., Mak, C.C., Peng, S.S., Wang, W.C., Lin, Y.L., Hwu, W.L., Lee, S.J., Lee, N.C.
- Source
- Full text @ Cell Death Discov
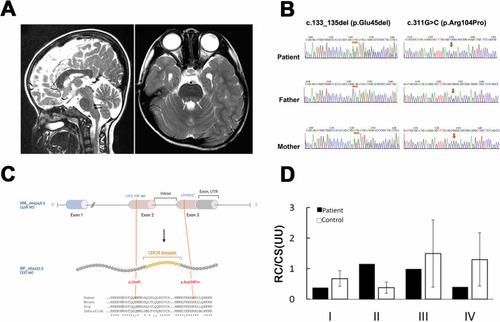
NDUFB7 is the disease causative gene. |
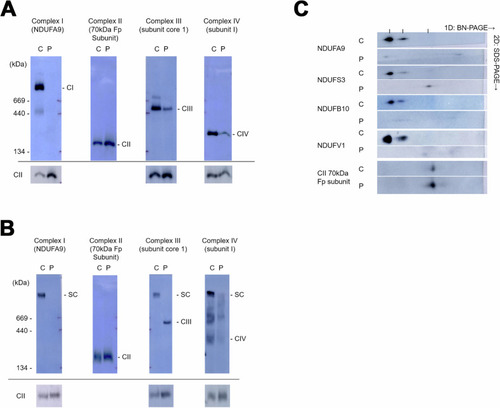
Mitochondrial complex formation is disrupted in fibroblasts derived from the patient carrying the NDUFB7 mutations. Using blue native polyacrylamide gel electrophoresis (BN-PAGE), mitochondrial extracts from control (C) and patient (P) skin fibroblasts were separated using Triton |
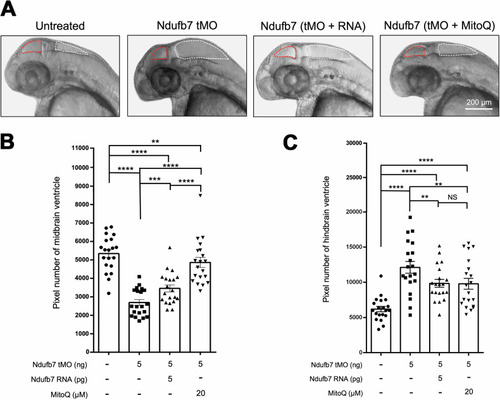
Knockdown of Ndufb7 changes the sizes of brain ventricles. We microinjected 1-cell stage zebrafish embryos without (untreated) or with indicated reagents and photographed them under a stereomicroscope at 48 hours post-fertilization. PHENOTYPE:
|
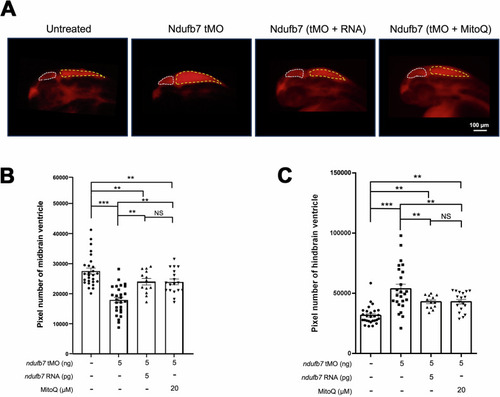
Knockdown of Ndufb7 changes the sizes of brain ventricles revealed by dextran rhodamine injection. PHENOTYPE:
|
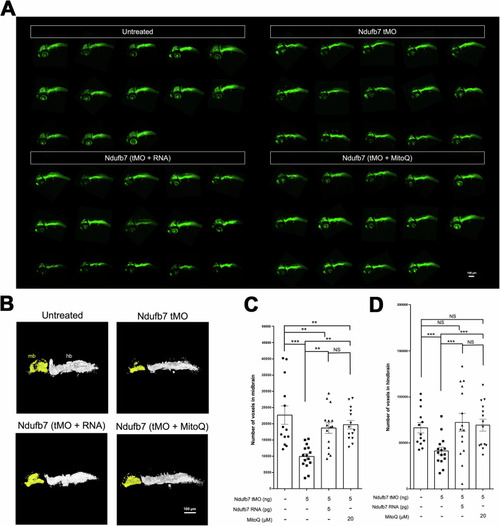
Knockdown of Ndufb7 reduces the neuronal volume of the brain. Transgenic Tg( PHENOTYPE:
|
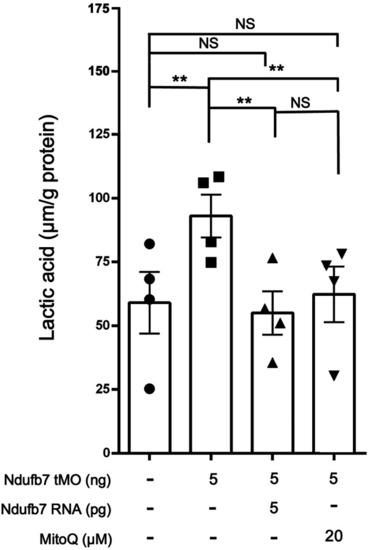
Knockdown of Ndufb7 increases the lactic acid in zebrafish embryos. We injected 1-cell stage zebrafish embryos without or with indicated reagents as described in Fig. PHENOTYPE:
|
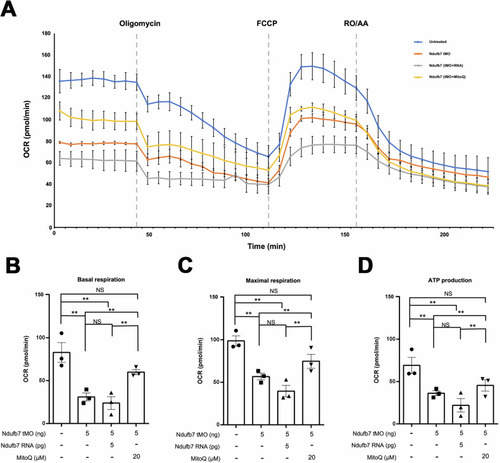
Knockdown of Ndufb7 reduces the oxygen consumption rate. We treated one-cell stage zebrafish embryos without or with indicated Ndufb7 translational-blocking morpholino oligonucleotides (tMO), and Ndufb7 mRNA or Mitoquinone mesylate (MitoQ) as described in Fig. PHENOTYPE:
|