
- Title
-
Exploring the potential mechanism of B-phycoerythrin on DSS-induced colitis and colitis-associated bone loss based on network pharmacology, molecular docking, and experimental validation
- Authors
- Deng, L., Feng, Z., Li, X., Fan, L., Wu, X., Tavakoli, S., Zhu, Y., Ye, H., Wu, K.
- Source
- Full text @ Sci. Rep.

(A) Representative images of the zebrafish colon for each group. (B) The colon length of zebrafish across the different groups. (C) Representative H&E staining of zebrafish from each group. (D) Representative images of intestinal neutrophil cells in zebrafish from each group. (E) The quantification of intestinal neutrophil cells in zebrafish for each group. Data are presented as mean ± SD. #P < 0.05 and ##P < 0.01 versus the control group. *P < 0.05 and **P < 0.01 versus the model group. |

(A1–D1) Fluorescence images depicting the entire zebrafish skeleton at 4× magnification. (A2–D2) Fluorescence intensity images of zebrafish skulls at 20× magnification. (E) Quantification of the relative fluorescence intensity of zebrafish skulls. (F) Quantification of the fluorescence area of zebrafish skulls. Data are presented as mean ± SD. #P < 0.05 versus the control group. *P < 0.05 and **P < 0.01 versus the model group. |

Network pharmacology analysis of B-PE against OP and IBD. (A) Common targets of B-PE, OP, and IBD. (B) PPI network of common targets. (C) GO enrichment analysis of common targets. (D) KEGG enrichment analysis of common targets. |

Molecular docking of B-PE with PI3K (A) and AKT1 (B). |
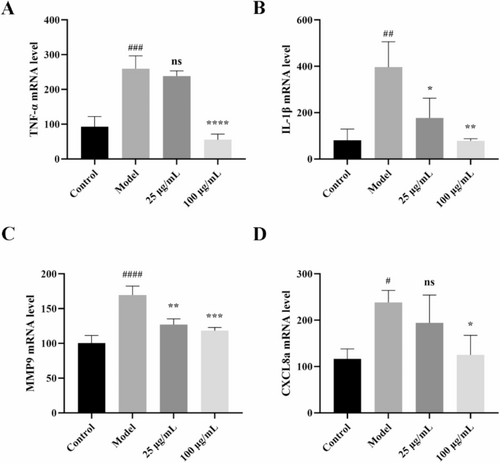
The relative mRNA levels of TNF-α (A), IL-1β (B), MMP9 (C), and CXCL8a (D) were quantified using qRT-PCR. Data are presented as mean ± SD. #P < 0.05, ##P < 0.01, ###P < 0.001, and ####P < 0.0001 versus the control group. *P < 0.05, **P < 0.01, ***P < 0.001, and ****P < 0.0001 versus the model group. |
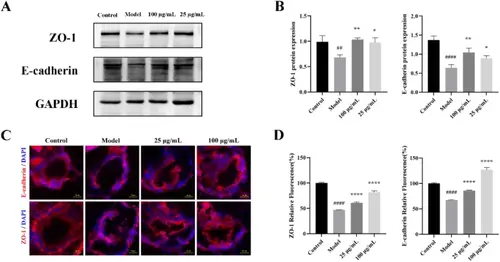
(A) Western blot analysis of ZO-1 and E-cadherin proteins expressions. (B) Quantification of ZO-1 and E-cadherin proteins expressions levels. (C) Images of immunofluorescence staining in zebrafish colon tissues. (D) Quantification of the relative fluorescence intensity of ZO-1 and E-cadherin. Data are presented as mean ± SD. ##P < 0.01 and ####P < 0.0001 versus the control group. *P < 0.05, **P < 0.01, and ****P < 0.0001 versus the model group. |
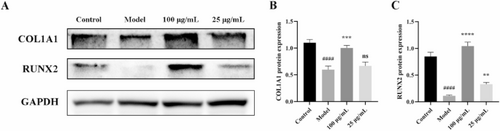
(A) Western blot analysis of COL1A1 and RUNX2 proteins expressions. (B) Quantification of COL1A1 protein expression level. (C) Quantification of RUNX2 protein expression level. Data are presented as mean ± SD. ####P < 0.0001 versus the control group. **P < 0.01, ***P < 0.001, and ****P < 0.0001 versus the model group. |
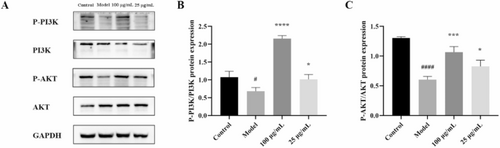
(A) Western blot analysis of p-PI3K, PI3K, p-AKT, and AKT proteins expressions. (B) Quantification of p-PI3K protein expression level normalized by PI3K. (C) Quantification of p-AKT protein expression level normalized by AKT. Data are presented as mean ± SD. #P < 0.05 and ####P < 0.0001 versus the control group. *P < 0.05, ***P < 0.001, and ****P < 0.0001 versus the model group. |