
Image
|
Figure Caption
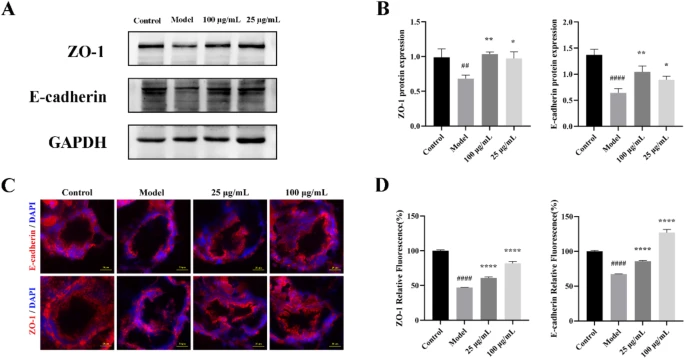
Fig. 6 (A) Western blot analysis of ZO-1 and E-cadherin proteins expressions. (B) Quantification of ZO-1 and E-cadherin proteins expressions levels. (C) Images of immunofluorescence staining in zebrafish colon tissues. (D) Quantification of the relative fluorescence intensity of ZO-1 and E-cadherin. Data are presented as mean ± SD. ##P < 0.01 and ####P < 0.0001 versus the control group. *P < 0.05, **P < 0.01, and ****P < 0.0001 versus the model group.
Acknowledgments
This image is the copyrighted work of the attributed author or publisher, and
ZFIN has permission only to display this image to its users.
Additional permissions should be obtained from the applicable author or publisher of the image.
Full text @ Sci. Rep.