
Image
|
Figure Caption
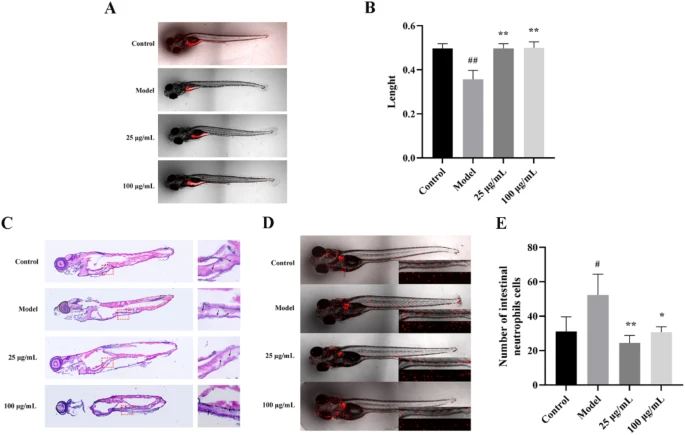
Fig. 1 (A) Representative images of the zebrafish colon for each group. (B) The colon length of zebrafish across the different groups. (C) Representative H&E staining of zebrafish from each group. (D) Representative images of intestinal neutrophil cells in zebrafish from each group. (E) The quantification of intestinal neutrophil cells in zebrafish for each group. Data are presented as mean ± SD. #P < 0.05 and ##P < 0.01 versus the control group. *P < 0.05 and **P < 0.01 versus the model group.
Acknowledgments
This image is the copyrighted work of the attributed author or publisher, and
ZFIN has permission only to display this image to its users.
Additional permissions should be obtained from the applicable author or publisher of the image.
Full text @ Sci. Rep.