
- Title
-
Midkine-a interacts with Ptprz1b to regulate neural plate convergence and midline formation in the developing zebrafish hindbrain
- Authors
- Le, Y., Rajasekhar, K., Loo, T.Y.J., Saunders, T.E., Wohland, T., Winkler, C.
- Source
- Full text @ Dev. Biol.

Expression and interaction of zebrafish Mdka, Mdkb and Ptn with Ptprz1b. (A) Hybridization chain reaction RNA in situ hybridization (HCR) of mdka, mdkb and ptn expression in wildtype embryos at 10 hpf (neural plate stage) and 12 hpf (early neural keel stage). Upper panels are representative maximum-intensity-projection (MIP) dorsal views with dlx3b (magenta) demarcating the neural plate/keel boundary. Arrow heads indicate mdka and mdkb expression (cyan) at 10 hpf. The lower panels are reconstructed orthogonal views from the position indicated by yellow dashed lines in the upper panels. The outlines of neural plate/keel are marked by white dashed lines, and otic vesicles flanking r5 are labelled with white asterisks. Scale bars = 50 μm. (B) Fluorescent RNA in situ hybridization (FISH) of mdka, mdkb and ptn expression in wildtype embryos at 14 hpf. Left: Schematic diagram of hindbrain organization, dorsal view with dashed box indicating rhombomere region (r1 to r6) analyzed by FISH. NC = negative control (mdka sense probe). Representative MIP images showing dorsal views and pseudo-colored in fire LUT with an intensity range from 0 to 255 by ImageJ. Dashed lines delineate lateral edges of rhombomeres, white asterisks indicate position of otic vesicles at r5. Scale bars = 50 μm. (C) Mean fluorescent intensity of FISH signals in (B) along anteroposterior axis of r1 to r6. (D) Representative MIP images after proximity ligation assay (PLA) of controls and different pairs of ligands (Mdka, Mdkb, Ptn) and receptor (Ptprz1b). Embryos injected with HA-ptprz1b mRNA alone served as the negative control (NC). Positive controls (PC) are mdka-MYC mRNA-injected embryos using two pairing secondary antibodies that recognize the same primary antibody. Embryos co-injected with mdka-MYC and secreted EGFP (secEGFP) mRNA served as random collision controls. PLA signals are represented in cyan, and DAPI in magenta. Scale bars = 20 μm. (E) Statistical analysis of PLA levels normalized to DAPI signals after thresholding (PLA/DAPI area ratios). Data are presented as scattered dots with mean ± SD. Statistical analysis was performed on Estimation Stats (https://www.estimationstats.com) to compare each dataset with the random collision control. P values are calculated from a two-sided permutation t-test under a CI of 95% and listed in Fig. S1G. Asterisks indicate statistical significance (P < 0.05). (F) Representative super resolution single plane images of PLA signals from Mdka-MYC/Mdkb-MYC/Ptn-MYC and mEGFP-Ptprz1b, respectively. mEGFP-Ptprz1b is colored in cyan, PLA in magenta, and DAPI in gray. PLA signals on plasma membrane are indicated by yellow arrowheads. Scale bars = 20 μm. (G-J) FCCS measurements were performed on MZ ptprz1b embryos at 4 hpf that had been injected with the indicated mRNAs at 1-cell stage. Green and red curves are auto-correlation functions plotted from green and red fluorophore channels, respectively. Blue curves represent the cross-correlation function. All curves were fitted by a 3D-2 particles model as represented by black curves, respectively. (G) MZ ptprz1b mutant embryos expressing Ptn-mEGFP and PMT-mApple were used as negative control. (H) MZ ptprz1b mutant embryos expressing membrane bound PMT-mEGFP-mApple were used as positive control. (I) Data obtained from MZ ptprz1b embryos that were co-injected with ptn-mEGFP and ptprz1b-mApple mRNA. The relative cross-correlation values of FCCS measurements are shown in (J) in the form of mean ± SD. (For interpretation of the references to colour in this figure legend, the reader is referred to the Web version of this article.) |
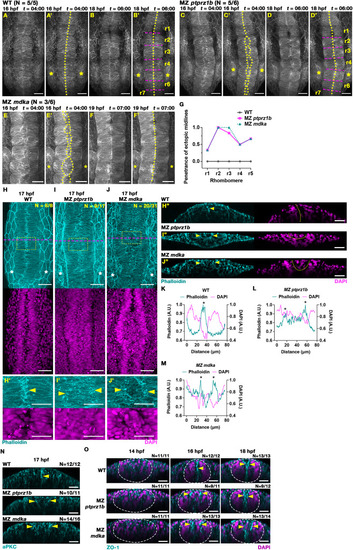
MZ ptprz1b, MZ mdka and MZ ptn mutants exhibit transient ectopic midline formation in rhombomeres. (A-B) Representative MIP still images in dorsal views taken from confocal time-lapse analysis at 4 and 6 h of time-lapse showing normal midline formation in rhombomeres of WT embryos. Imaging was done from approx. 12 hpf with 4 min intervals. PMT-mEGFP was injected to mark cell membranes. Elapsed time (t) is displayed as hours:minutes (hh:mm). Midline structures are delineated by yellow dotted lines. Magenta dashed lines delineate rhombomere boundaries. Asterisks label position of otic vesicles at r5. Scale bar = 50 μm. (C-D) Transient ectopic midline in MZ ptprz1b mutant labelled by PMT-mEGFP. Scale bar = 50 μm. (E-F) Transient ectopic midline in MZ mdka mutant labelled by PMT-mApple. Still images taken from confocal time-lapse analysis at 4 and 7 h. Scale bar = 50 μm. (G) Quantification of penetrance of ectopic midline phenotype in each rhombomere in WT (N = 5), MZ ptprz1b (N = 6) and MZ mdka (N = 6). Data were acquired from three independent experiments. The penetrance of ectopic midlines is calculated by dividing the number of embryos with ectopic midlines in each rhombomere by the total number of embryos. (H-J) Representative MIP images of Phalloidin stained F-actin (cyan) and DAPI stained nuclei (magenta) in rhombomere region of WT, MZ ptprz1b and MZ mdka mutant embryos at 17 hpf. Yellow dashed boxes indicate region shown in (H′-J′), and magenta dashed lines indicate the position of reconstructed orthogonal views shown in (H″-J″). Scale bar = 50 μm (H-J) and 30 μm (H′-J′, H″-J″). Arrowheads indicate F-actin accumulation. (K-M) Respective mean fluorescent intensity histograms of Phalloidin (cyan) and DAPI (magenta) along left-right axis of (H′-J′). Asterisks highlight aggregation of Phalloidin-stained F-actin. (N) Representative reconstructed orthogonal views of aPKCζ (cyan) immunostaining in WT, MZ ptprz1b and MZ mdka mutant at 17 hpf. Views are taken from r2 at comparable positions. Yellow arrowheads indicate aggregation of aPKCζ, respectively. Scale bar = 30 μm (O) Representative reconstructed orthogonal views after ZO-1 (cyan) and DAPI (magenta) staining in WT, MZ ptprz1b and MZ mdka mutant at 14, 16 and 18 hpf. Images are taken from r2 at comparable positions. Accumulation of ZO-1 is indicated by yellow arrowheads, and neural keel/rod is demarcated by white dashed lines. Scale bar = 30 μm. (For interpretation of the references to colour in this figure legend, the reader is referred to the Web version of this article.) |
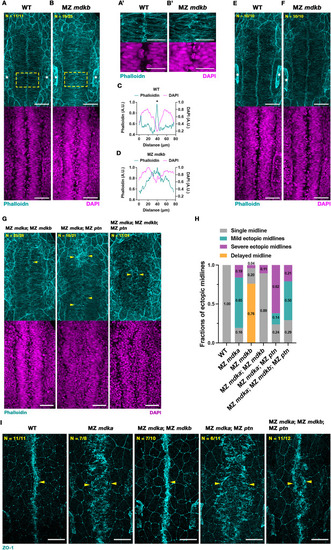
A mutation in mdkb rescues midline defects in MZ mdka mutants. (A-B) Representative MIP images of Phalloidin (cyan) and DAPI (magenta) stained WT and MZ mdkb mutant embryos at 17 hpf. Distinctive F-actin accumulation in medial region of WT (A), in contrast to MZ mdkb mutants (B). Nuclei distribution was similar in WT and MZ mdkb mutants (lower images). Positions of otic vesicles are labelled by white asterisks. Yellow dashed boxes indicate regions shown with higher magnification in (A′-B′). Scale bars = 50 μm (A-B) and 30 μm (A′-B′). (C-D) Quantification of mean fluorescent intensity of Phalloidin (cyan) and DAPI (magenta) along left-right axis of (A′-B′). Asterisks show the accumulation of Phalloidin-stained F-actin. (E-F) At 18 hpf, distinctive F-actin accumulation was found in both WT and MZ mdkb mutant embryos. The positions of otic vesicles are indicated by asterisks. Scale bars = 50 μm. (G) Representative MIP images of Phalloidin stained F-actin (cyan) and DAPI stained nuclei (magenta) in rhombomere region of WT, MZ mdka; MZ mdkb, MZ mdka; MZ ptn double mutant and MZ mdka; MZ mdkb; MZ ptn triple mutant embryos at 17 hpf. Yellow arrowheads indicate F-actin accumulation at a single midline in WT and MZ mdka; MZ mdkb mutants and at ectopic midlines in MZ mdka; MZ ptn double and MZ mdka; MZ mdkb; MZ ptn triple mutants. Scale bar = 50 μm. (H) Categorization of midline phenotypes in WT, MZ mdka, MZ mdkb, MZ mdka; MZ mdkb, MZ mdka; MZ ptn and MZ mdka; MZ mdkb; MZ ptn mutants. Data of WT and MZ mdka was also shown in Fig. 2H–J. (I) Representative MIP dorsal views after ZO-1 (cyan) staining in WT, MZ mdka, MZ mdka; MZ mdkb, MZ mdka; MZ ptn and MZ mdka; MZ mdkb; MZ ptn mutants at 17 hpf. Accumulation of ZO-1 is indicated by yellow arrowheads. Scale bar = 50 μm. (For interpretation of the references to colour in this figure legend, the reader is referred to the Web version of this article.) |
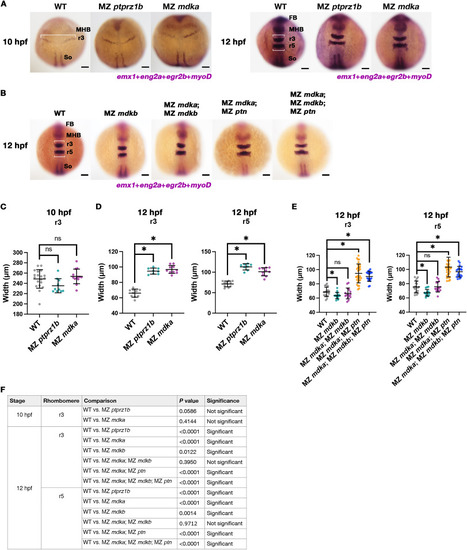
MZ ptprz1b and MZ mdka mutants exhibit delayed neural keel convergence. (A-B) Whole-mount in situ RNA hybridization of WT, MZ ptprz1b and MZ mdka embryos at 10 and 12 hpf, and MZ mdkb, MZ mdka; MZ mdkb, MZ mdka; MZ ptn and MZ mdka; MZ mdkb; MZ ptn mutant embryos at 12 hpf. The maximum width of forming r3 and r5 is measured (white bar) using egr2b as a marker. Forebrain, mid-hindbrain boundary and somites are labelled by emx1, eng2a and myoD as landmarks, respectively. (C-F) Quantification of maximum width of r3 at 10 hpf (C) and r3 and r5 at 12 hpf (D-E). Data are presented as scattered dots. Mean ± SD of each dataset is indicated by line and error bar. Statistical comparison was performed between WT (N = 19, 10 hpf; N = 10, 12 hpf) and MZ ptprz1b (N = 10, 10 hpf; N = 8, 12 hpf) or MZ mdka (N = 13, 10 hpf; N = 10, 12 hpf) and between WT (N = 20, 12 hpf) and MZ mdkb (N = 15, 12 hpf), or MZ mdka; MZ mdkb (N = 15, 12 hpf) or MZ mdka; MZ ptn (N = 30, 12 hpf) or MZ mdka; MZ mdkb; MZ ptn (N = 20, 12 hpf) on Estimation Stats (https://www.estimationstats.com). P values calculated by two-sided permutation t-tests under a CI of 95% are shown in (F). Asterisks indicate statistical significance (P < 0.05). |
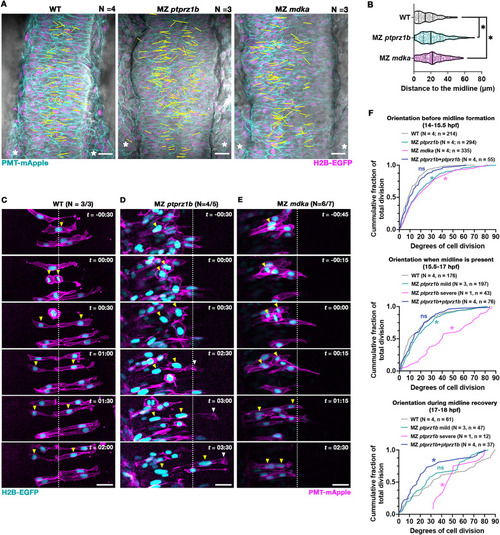
MZ ptprz1b and MZ mdka mutant cells show misplaced C-divisions and a failure in contralateral intercalation. (A) Representative single-plane still images (dorsal views) taken from time-lapse movies of WT (N = 4), MZ ptprz1b (N = 3) and MZ mdka mutants (N = 3). PMT-mApple (cyan) labels cell membranes, H2B-EGFP (magenta) marks nuclei and DIC is shown in gray. Yellow lines indicate XY-position and direction of C-divisions superimposed from Z-planes and timepoints of interests. Lines are drawn by linking the respective middle points of two separating pairs of chromosomes at telophase. Scale bar = 20 μm. (B) Quantification of relative distances of C-divisions to middle of neural keel in WT (N = 4), MZ ptprz1b (N = 3) and MZ mdka mutants (N = 3) mutants. A total of 215, 201 and 269 C-division events were identified and analyzed in WT, MZ ptprz1b and MZ mdka single mutants, respectively. Data are presented as truncated violin plots, where center lines represent the median and limits show the first and third quartiles, respectively. Each scatter dot indicates a C-division event. Statistical analysis was performed using Estimation Stats (https://www.estimationstats.com), between WT and MZ ptprz1b or MZ mdka with a CI of 99%. (C-E) Representative C-division events in WT (C), MZ ptprz1b (D) and MZ mdka (E) mutants. Cells were mosaically labelled with H2B-EGFP (cyan) and PMT-mApple (magenta) by injecting mRNAs into single cells at 32-cell stage. Timelapse acquisition started at 14–15 hpf, and time (t) is indicated as hours:minutes (hh:mm). White dashed lines label presumptive midline of neural keel. Yellow arrowheads indicate nuclei position of cells during C-division. Mutant cell that crosses the presumptive midline after C-division is labelled with white arrowhead. Scale bar = 20 μm. (F) Quantification of relative angles of cell divisions to mediolateral axis in WT (N = 4), MZ ptprz1b (N = 4), and MZ mdka mutants (N = 4), and in MZ ptprz1b single mutants with mosaic overexpression of ptprz1b-mApple mRNA (N = 4). Divisions horizontal to mediolateral axis are defined as 0°, while divisions perpendicular to mediolateral axis are defined as 90°. Data were categorized into three periods, period before the midlines formed (14–15.5 hpf), period when midline or ectopic midlines were present (15.5–17 hpf), and the period when ectopic midlines started to merge (17–18 hpf). Data are presented as cumulative frequency graph with numbers of samples (N) and numbers of divisions (n) listed. Kolmogorov-Smirnov tests were performed with a CI of 95% to compare the mean between WT (N = 4) and MZ ptprz1b (N = 4), MZ mdka (N = 4) or MZ ptprz1b overexpressing ptprz1b-mApple (N = 4) and between WT (N = 4) and MZ ptprz1b with mild midline defects (N = 3), MZ ptprz1b with severe midline defects (N = 1) or MZ ptprz1b overexpressing ptprz1b (N = 4). Calculated P values are listed in Fig. S6F. Asterisks indicate statistical significance between samples and WT, respectively (P < 0.05). (For interpretation of the references to colour in this figure legend, the reader is referred to the Web version of this article.) |
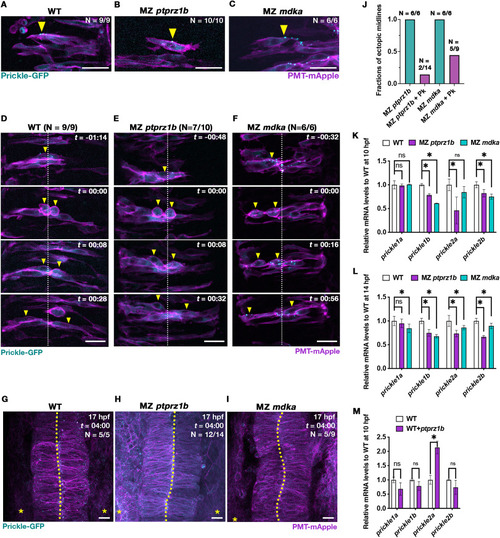
Drosophila Prickle-EGFP rescues midline formation in MZ ptprz1b and MZ mdka mutants that exhibit downregulated prickle expression. (A-C) Representative single-plane images (dorsal views) of neural progenitors in WT (A), MZ ptprz1b (B) and MZ mdka mutant rhombomeres (C) showing localization of injected Drosophila Prickle-EGFP (cyan) at 14 hpf. Cell clones were labelled by co-injection of prickle-EGFP and PMT-mApple mRNA into single cells at the 32-cell stage. Arrowheads indicate anteriorly localized Prickle puncta. Scale bar = 20 μm. (D-F) Representative MIP images of Prickle-EGFP expressing neural progenitors undergoing C-division in WT (D), MZ ptprz1b (E) and MZ mdka mutant rhombomeres (F) between 14 and 17 hpf. Scatter cell labelling was achieved through co-injection of prickle-EGFP and PMT-mApple mRNA into single cells at the 32-cell stage. Time (t) is indicated as hours:minutes (hh:mm). Yellow arrowheads indicate cell postioning during C-division localized. White dashed lines label presumptive midline of neural keel. Scale bar = 20 μm. (G-I) MIP images showing normal midline morphology in rhombomeres at 17 hpf in WT (G), MZ ptprz1b (H) and MZ mdka single mutants (I) injected with prickle-EGFP mRNA. Scale bar = 20 μm. (J) Quantification of ectopic midline penetrance in MZ ptprz1b and MZ mdka mutants injected with PMT-mEGFP/PMT-mApple mRNA with and without prickle-EGFP mRNA. Data for PMT-mEGFP/PMT-mApple mRNA injected mutants were taken from (Fig. 2). Sample numbers are indicated on top of each bar. (K-L) Relative qPCR quantification of prickle1a, prickle1b, prickle2a and prickle2b expression at 10 hpf (K) and 14 hpf (L). Data are shown in the format of mean ± SEM. Asterisks label statistical significance between WT and mutants after statistical analyses (CI = 95%, P < 0.05, see Material and Methods). (M) Relative qPCR quantification of prickle1a, prickle1b, prickle2a and prickle2b expression in WT overexpressing ptprz1b at 10 hpf after injection of ptprz1b-mApple mRNA. Data are shown as mean ± SEM, and statistical significance between WT and ptprz1b-overexpressing WT is labelled by asterisks after statistical analyses (CI = 95%, P < 0.05, see Material and Methods). (For interpretation of the references to colour in this figure legend, the reader is referred to the Web version of this article.) |
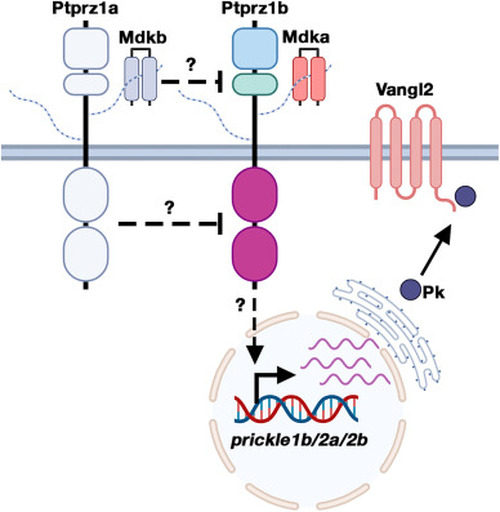
Hypothetical model of signalling crosstalk between Mdka-Ptprz1b and the noncanonical Wnt/PCP pathway. Mdka-Ptprz1b signalling facilitates transcription of prickle1b, prickle2a and prickle2b to contribute to Wnt/PCP signalling. Mdkb acts as an antagonist of Mdka-Ptprz1b signalling likely through competing with Mdka for Ptprz1b binding to prevent receptor activation or by inducing receptor dimer formation to inhibit intracellular protein tyrosine phosphatase activity |
Reprinted from Developmental Biology, , Le, Y., Rajasekhar, K., Loo, T.Y.J., Saunders, T.E., Wohland, T., Winkler, C., Midkine-a interacts with Ptprz1b to regulate neural plate convergence and midline formation in the developing zebrafish hindbrain, , Copyright (2025) with permission from Elsevier. Full text @ Dev. Biol.