
Fig. 5
- ID
- ZDB-FIG-250416-36
- Publication
- Le et al., 2025 - Midkine-a interacts with Ptprz1b to regulate neural plate convergence and midline formation in the developing zebrafish hindbrain
- Other Figures
- All Figure Page
- Back to All Figure Page
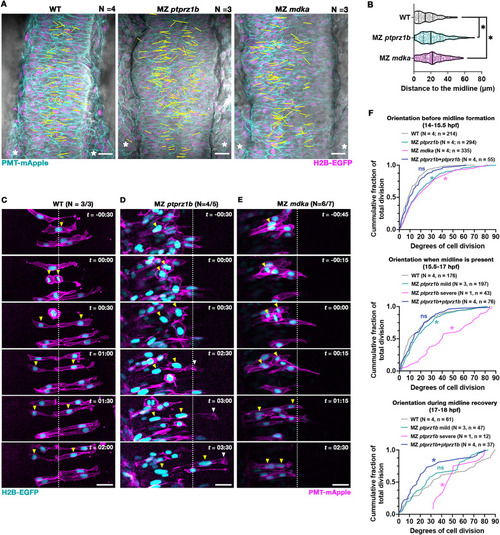
MZ ptprz1b and MZ mdka mutant cells show misplaced C-divisions and a failure in contralateral intercalation. (A) Representative single-plane still images (dorsal views) taken from time-lapse movies of WT (N = 4), MZ ptprz1b (N = 3) and MZ mdka mutants (N = 3). PMT-mApple (cyan) labels cell membranes, H2B-EGFP (magenta) marks nuclei and DIC is shown in gray. Yellow lines indicate XY-position and direction of C-divisions superimposed from Z-planes and timepoints of interests. Lines are drawn by linking the respective middle points of two separating pairs of chromosomes at telophase. Scale bar = 20 μm. (B) Quantification of relative distances of C-divisions to middle of neural keel in WT (N = 4), MZ ptprz1b (N = 3) and MZ mdka mutants (N = 3) mutants. A total of 215, 201 and 269 C-division events were identified and analyzed in WT, MZ ptprz1b and MZ mdka single mutants, respectively. Data are presented as truncated violin plots, where center lines represent the median and limits show the first and third quartiles, respectively. Each scatter dot indicates a C-division event. Statistical analysis was performed using Estimation Stats (https://www.estimationstats.com), between WT and MZ ptprz1b or MZ mdka with a CI of 99%. (C-E) Representative C-division events in WT (C), MZ ptprz1b (D) and MZ mdka (E) mutants. Cells were mosaically labelled with H2B-EGFP (cyan) and PMT-mApple (magenta) by injecting mRNAs into single cells at 32-cell stage. Timelapse acquisition started at 14–15 hpf, and time (t) is indicated as hours:minutes (hh:mm). White dashed lines label presumptive midline of neural keel. Yellow arrowheads indicate nuclei position of cells during C-division. Mutant cell that crosses the presumptive midline after C-division is labelled with white arrowhead. Scale bar = 20 μm. (F) Quantification of relative angles of cell divisions to mediolateral axis in WT (N = 4), MZ ptprz1b (N = 4), and MZ mdka mutants (N = 4), and in MZ ptprz1b single mutants with mosaic overexpression of ptprz1b-mApple mRNA (N = 4). Divisions horizontal to mediolateral axis are defined as 0°, while divisions perpendicular to mediolateral axis are defined as 90°. Data were categorized into three periods, period before the midlines formed (14–15.5 hpf), period when midline or ectopic midlines were present (15.5–17 hpf), and the period when ectopic midlines started to merge (17–18 hpf). Data are presented as cumulative frequency graph with numbers of samples (N) and numbers of divisions (n) listed. Kolmogorov-Smirnov tests were performed with a CI of 95% to compare the mean between WT (N = 4) and MZ ptprz1b (N = 4), MZ mdka (N = 4) or MZ ptprz1b overexpressing ptprz1b-mApple (N = 4) and between WT (N = 4) and MZ ptprz1b with mild midline defects (N = 3), MZ ptprz1b with severe midline defects (N = 1) or MZ ptprz1b overexpressing ptprz1b (N = 4). Calculated P values are listed in Fig. S6F. Asterisks indicate statistical significance between samples and WT, respectively (P < 0.05). (For interpretation of the references to colour in this figure legend, the reader is referred to the Web version of this article.) |
Reprinted from Developmental Biology, , Le, Y., Rajasekhar, K., Loo, T.Y.J., Saunders, T.E., Wohland, T., Winkler, C., Midkine-a interacts with Ptprz1b to regulate neural plate convergence and midline formation in the developing zebrafish hindbrain, , Copyright (2025) with permission from Elsevier. Full text @ Dev. Biol.