
- Title
-
Brevianamide F Exerts Antithrombotic Effects by Modulating the MAPK Signaling Pathway and Coagulation Cascade
- Authors
- Zhang, H., Sun, C., Xia, Q., Li, P., Liu, K., Zhang, Y.
- Source
- Full text @ Mar. Drugs

( |
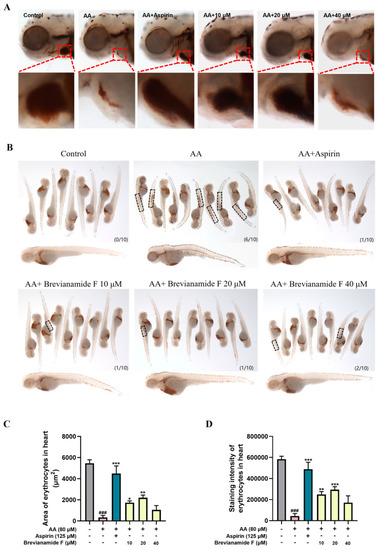
Representative images of heart region ( |
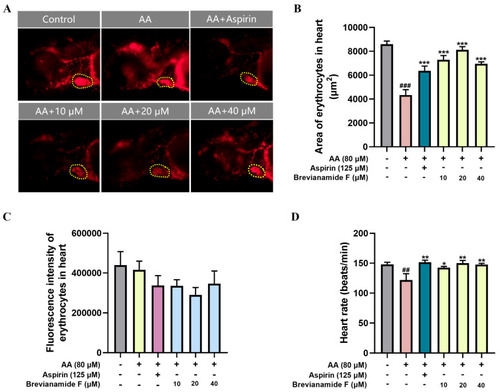
( |
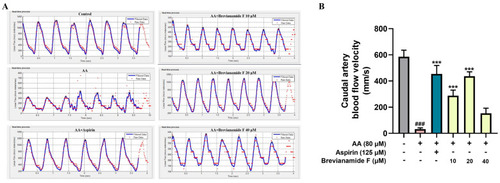
( |
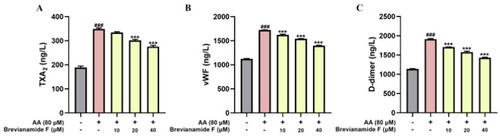
The levels of ( |
( |
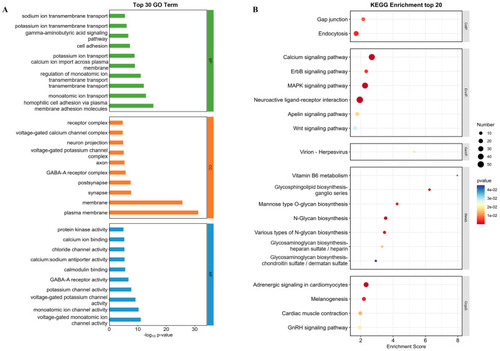
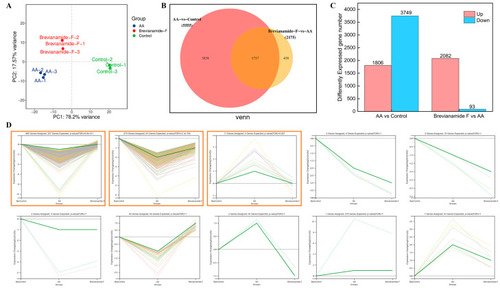
The effect of Brevianamide F on intersection DEGs with significant trend changes. ( |
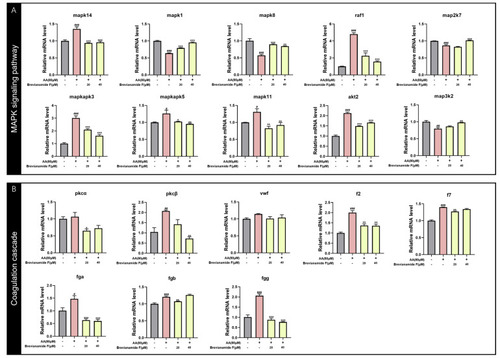
Effects of Brevianamide F on the expression of genes related to the MAPK pathway and coagulation cascade; # |
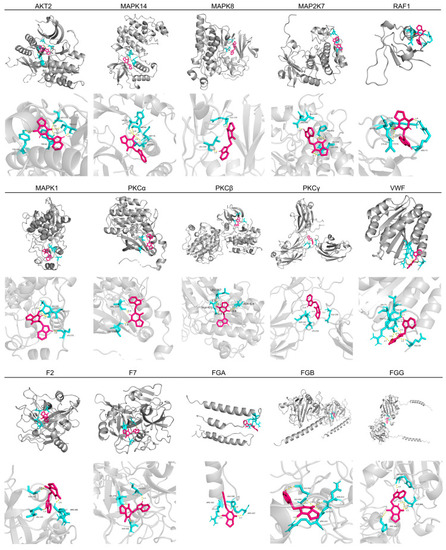
The molecular docking results of Brevianamide F with key targets. Each result contains an overall picture and a local zoomed-in picture. Red color indicates the molecular structure of Brevianamide F. Hydrogen bonds are shown in yellow and amino acid residues are shown in blue. |