IMAGE

Figure 2

ID
ZDB-IMAGE-241028-196
Source
Figures for Zhang et al., 2024
Image
Figure Caption

Figure 2

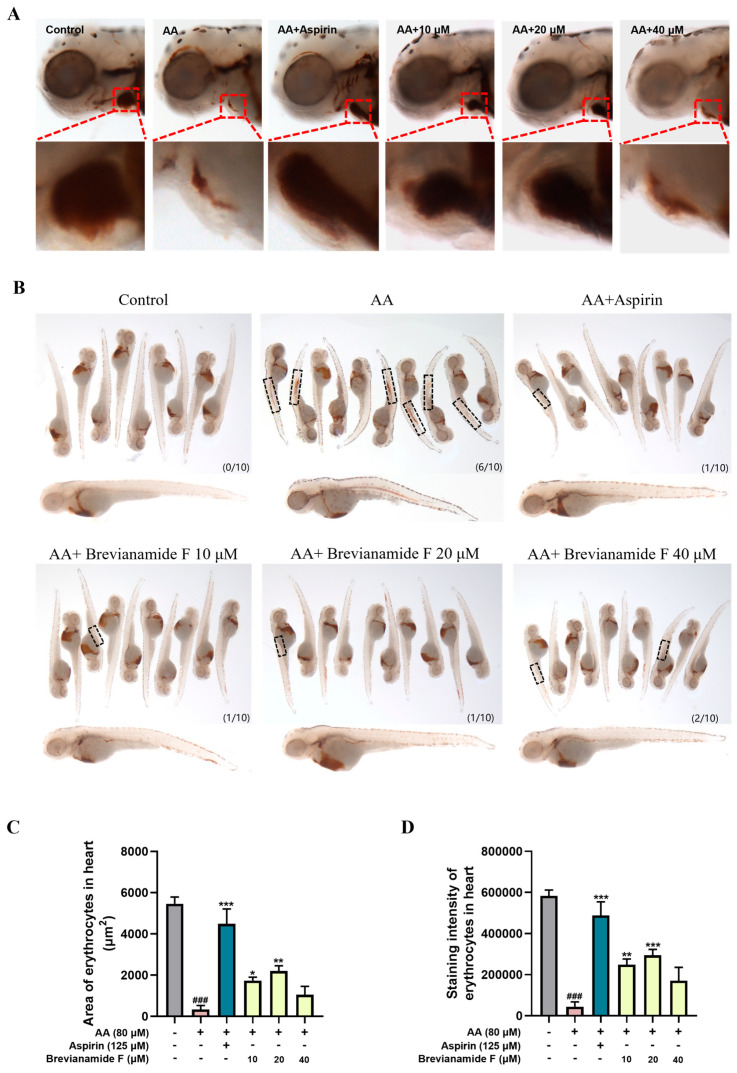
Representative images of heart region (A) and trunk region (B) of zebrafish stained with O-dianisidine in each group. The black frame indicates erythrocyte aggregation; the lower right corner was labeled as the number of zebrafish with erythrocyte staining in the trunk region/total number of zebrafish. Erythrocyte staining area (C) and staining intensity (D) in the heart. ###p < 0.001, compared with the blank control group; * p < 0.05, ** p < 0.01, and *** p < 0.001, compared with the AA group.

Acknowledgments
This image is the copyrighted work of the attributed author or publisher, and ZFIN has permission only to display this image to its users. Additional permissions should be obtained from the applicable author or publisher of the image. Full text @ Mar. Drugs