
- Title
-
foxe1 mutant zebrafish show indications of a hypothyroid phenotype and increased sensitivity to ethanol for craniofacial malformations
- Authors
- Raterman, S.T., Wagener, F.A.D.T.G., Zethof, J., Cuijpers, V., Klaren, P.H.M., Metz, J.R., Von den Hoff, J.W.
- Source
- Full text @ Dev. Dyn.
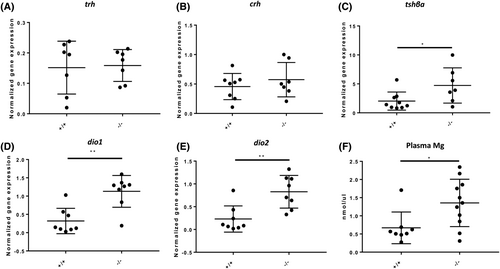
Foxe1 mutants are hypothyroid. (A, B) trh and crh relative gene expression levels in the adult hypothalamus of mutants are equal to wild type. (C) tshβ levels in the pituitary glands of adult foxe1 mutants are increased compared to wild types. (D, E) Relative expression of deiodinases dio1 and dio2 is increased in the livers of adult mutants compared to wild types (A–E, n = 8–10). (F) Hypermagnesemia in plasma of adult foxe1 mutants (n = 19). Data were analyzed with a Student's t-test. |
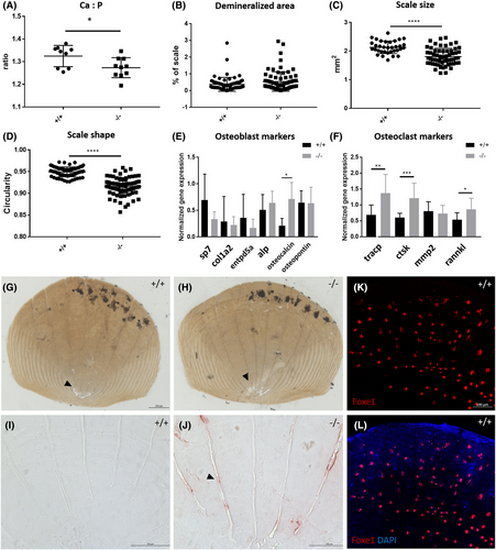
Scales of foxe1 mutants show increased osteoclast activity and Foxe1 expression. (A) The Ca:P ratio of scales is lower in mutants than in foxe1 wild types. (B) The demineralized areas of the scales were not significantly larger in mutants than in wild types. (C) The scales of mutants were reduced in size compared to the wild types. (D) The shape of the scales of mutants was less round compared to wild types. (E) Gene expression of osteoblast markers on wild type and mutant scales. (F) Gene expression of osteoclast markers on wild type and mutant scales (n = 12). (G, H) Wild type and mutant scale stained with Von Kossa to visualize mineralization, unmineralized areas (arrowheads) did not differ between mutant and wild type scales, but the shape and size of the scale was affected. (I, J) TRAcP staining (arrowhead) shows increased osteoclast activity in mutant scales. (K, L) Foxe1-positive cells at the posterior side of scales in wild type zebrafish, Foxe1 signal and merge. Scale bar (G, H) 200 μm, (I–L) 100 μm. Data were analyzed with a Student's t-test (in case of two groups) or two-way ANOVA or Kruskal-Wallis test (in case of more than two groups), where appropriate. |
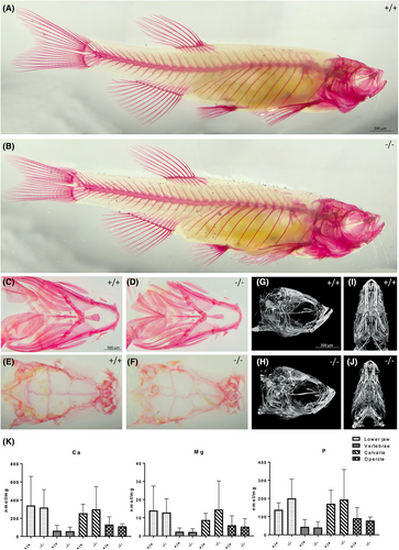
Adult craniofacial skeleton in foxe1 mutants. (A, B) Alizarin red staining of wild type and foxe1 mutant adult (3 cm SL) zebrafish. (C–F) Dissected wild type and mutant lower jaw and calvaria, ventral and dorsal view, respectively (n = 13). (G–J) 2 cm SL wild type and mutant microCT images (n = 3). (K) No difference in mineral contents of the lower jaw, vertebrae, calvaria, and opercle of wild type and mutant zebrafish (n = 10). Tissue data were analyzed with a Student's t-test (in case of two groups) or two-way ANOVA or Kruskal-Wallis test (in case of more than two groups), where appropriate. |
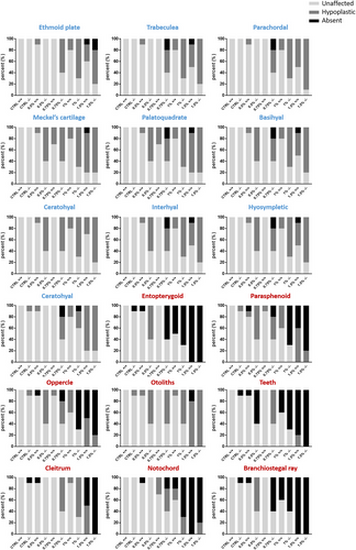
Foxe1 mutants are more severely affected by ethanol exposure than wild type fish. Wild type and mutant control groups showed normal craniofacial bone and cartilage development in control groups. Upon ethanol exposure between 6 and 120 hpf at 0.5%–1.5% malformations occurred in a subset of the samples. The severity of craniofacial malformations was consistently higher in mutant groups than wild type groups. n = 10 for ctrl and 0.5%–1.5% ethanol groups. Data were analyzed using Fisher's exact test (Supplemental Data 1). |
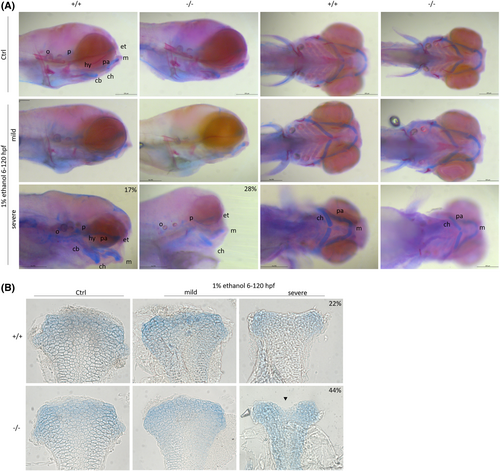
Foxe1 mutants and wild types are severely affected by 1% ethanol exposure. (A) Representative images of the effects of 1% ethanol exposure on bone and cartilage development in wild type and mutant larvae at 120 hpf. At 1% ethanol concentration, most of the fish were mildly phenotypic, mostly showing defects in bone development. In 17% (6/35) of wild types and 28% (14/49) of mutants more severe phenotypes were observed. In case of a more severe phenotype, the exposed wild types retained more cartilage elements than the exposed mutants. Cb: Ceratobranchial, ch: Ceratohyal, et: Ethmoid plate hy: Hyosympletic, m: Meckels, o: Otoliths, p: Parachordal, pa: Palatoquadrate. (B) Unexposed control individuals had normal ethmoid plates, while ethanol-exposed larvae had hypoplastic ethmoid plates with dents in the anterior edge or lack of cells in the midline. The incidence was higher in mutants 45/102 (44%) than in wild types 21/92 (22%). Scale bar (A) 200 μm, (B) 50 μm. Data were analyzed using Chi-square test. |
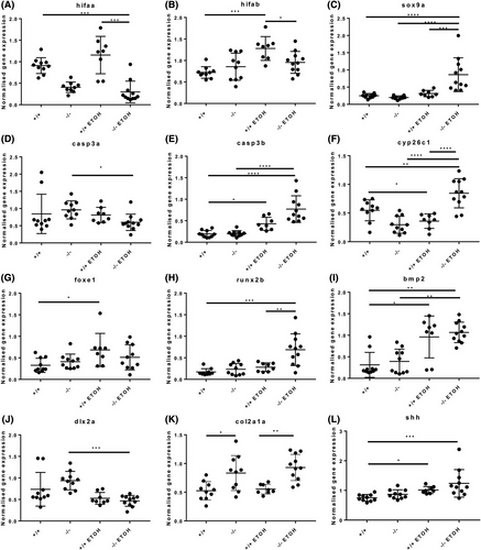
Foxe1-ethanol interactions cause differential gene expression of genes involved in cell death, hypoxia, and ethanol clearance. Relative gene expression of hifaa (A), hifab (B), sox9a (C), casp3a (D), casp3b (E), cyp26c1 (F), foxe1 (G), runx2b (H), bmp2 (I), dlx2a (J), col2a1a (K), and shh (L) in foxe1 mutants and wild types exposed to 0% and 1% ethanol. Data were analyzed with a two-way ANOVA on raw or transformed data. |