
|
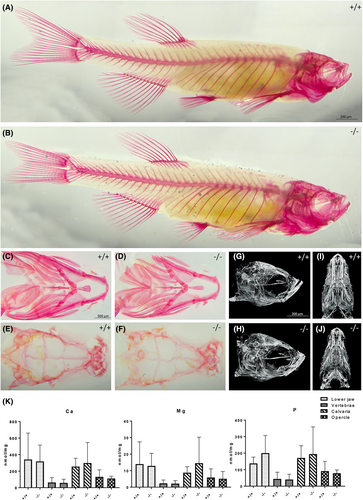
Fig. 3 Adult craniofacial skeleton in foxe1 mutants. (A, B) Alizarin red staining of wild type and foxe1 mutant adult (3 cm SL) zebrafish. (C–F) Dissected wild type and mutant lower jaw and calvaria, ventral and dorsal view, respectively (n = 13). (G–J) 2 cm SL wild type and mutant microCT images (n = 3). (K) No difference in mineral contents of the lower jaw, vertebrae, calvaria, and opercle of wild type and mutant zebrafish (n = 10). Tissue data were analyzed with a Student's t-test (in case of two groups) or two-way ANOVA or Kruskal-Wallis test (in case of more than two groups), where appropriate.