
- Title
-
Diverse Engraftment Capability of Neuroblastoma Cell Lines in Zebrafish Larvae
- Authors
- Lawrence, J.M., Tan, S.H., Kim, D.C., Tan, K.E., Schroeder, S.E., Yeo, K.S., Schaefer, M.A., Sosic, A.M., Zhu, S.
- Source
- Full text @ Zebrafish
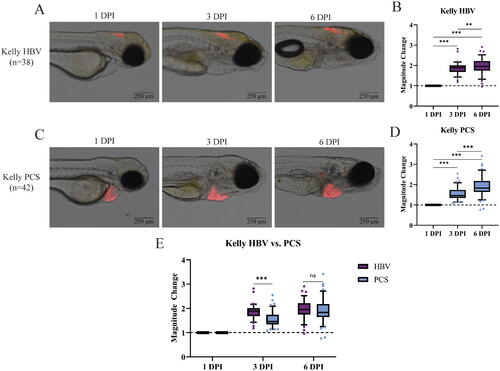
Kelly cells successfully engraft in the HBV and PCS of 48 hpf zebrafish, with an initial location preference appreciated for the HBV. (A) Representative HBV xenografted fish imaged at 1, 3, and 6 DPI. (B) Quantification of tumor volume change depicted in (A); whiskers extending to 10th and 90th percentile. (C) Representative PCS xenografted fish imaged at 1, 3, and 6 DPI. (D) Quantification of tumor volume change depicted in (C); whiskers extending to 10th and 90th percentile. (E) Comparison of tumor growth between the HBV and PCS at 1, 3, and 6 DPI. Tumor volume calculated at each timepoint by multiplication of fluorescent area and mean intensity value at imaging. Magnitude of change at 3 and 6 DPI normalized to tumor volume at 1 DPI for individual fish. *p < 0.05, **p < 0.02, ***p < 0.01, ns not significant. |
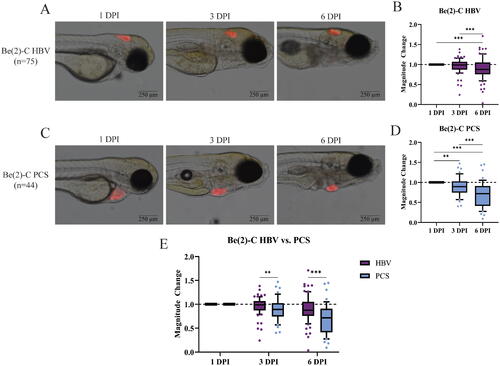
Be(2)-C cells fail to engraft in the HBV and PCS of 48 hpf zebrafish, with a location preference appreciated for the HBV. (A) Representative HBV xenografted fish imaged at 1, 3, and 6 DPI. (B) Quantification of tumor volume change depicted in (A); whiskers extending to 10th and 90th percentile. (C) Representative PCS xenografted fish imaged at 1, 3, and 6 DPI. (D) Quantification of tumor volume change depicted in (C); whiskers extending to 10th and 90th percentile. (E) Comparison of tumor growth between the HBV and PCS at 1, 3, and 6 DPI. Tumor volume calculated at each timepoint by multiplication of fluorescent area and mean intensity value at imaging. Magnitude of change at 3 and 6 DPI normalized to tumor volume at 1 DPI for individual fish. *p < 0.05, **p < 0.02, ***p < 0.01. |
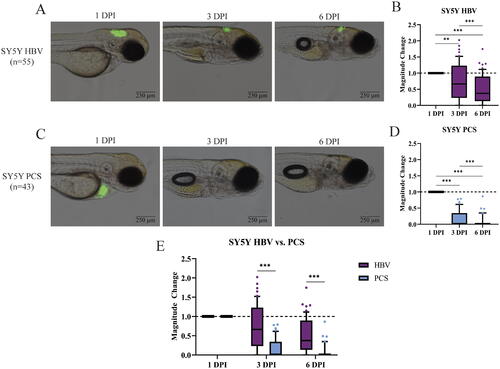
SY-5Y cells fail to engraft in the HBV and PCS of 48 hpf zebrafish, with near complete loss of cells in the PCS. (A) Representative HBV xenografted fish imaged at 1, 3, and 6 DPI. (B) Quantification of tumor volume change depicted in (A); whiskers extending to 10th and 90th percentile. (C) Representative PCS xenografted fish imaged at 1, 3, and 6 DPI. (D) Quantification of tumor volume change depicted in (C); whiskers extending to 10th and 90th percentile. (E) Comparison of tumor growth between the HBV and PCS at 1, 3, and 6 DPI. Tumor volume calculated at each timepoint by multiplication of fluorescent area and mean intensity value at imaging. Magnitude of change at 3 and 6 DPI normalized to tumor volume at 1 DPI for individual fish. *p < 0.05, **p < 0.02, ***p < 0.01. |
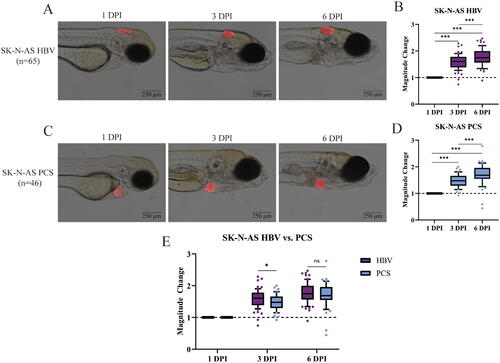
SK-N-AS cells successfully engraft in the HBV and PCS of 48 hpf zebrafish, with an initial location preference appreciated for the HBV. (A) Representative HBV xenografted fish imaged at 1, 3, and 6 DPI. (B) Quantification of tumor volume change depicted in (A); whiskers extending to 10th and 90th percentile. (C) Representative PCS xenografted fish imaged at 1, 3, and 6 DPI. (D) Quantification of tumor volume change depicted in (C); whiskers extending to 10th and 90th percentile. (E) Comparison of tumor growth between the HBV and PCS at 1, 3, and 6 DPI. Tumor volume calculated at each timepoint by multiplication of fluorescent area and mean intensity value at imaging. Magnitude of change at 3 and 6 DPI normalized to tumor volume at 1 DPI for individual fish. *p < 0.05, **p < 0.02, ***p < 0.01, ns, not significant. |
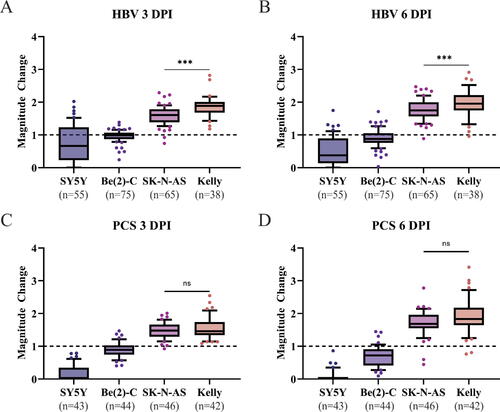
Kelly and SK-N-AS neuroblastoma cells engraft in the HBV and PCS of 48 hpf zebrafish while Be(2)-C tumor volume remains static and SY-5Y fails to engraft. (A, B) Comparison of tumor magnitude of change for four cell lines in the HBV at 3 DPI (A) and 6 DPI (B). (C, D) Comparison of tumor magnitude of change in the PCS for four cell lines at 3 DPI (C) and 6 DPI (D). Median magnitude of change at 3 and 6 DPI normalized to tumor volume at 1 DPI. ***p < 0.01, ns not significant. |