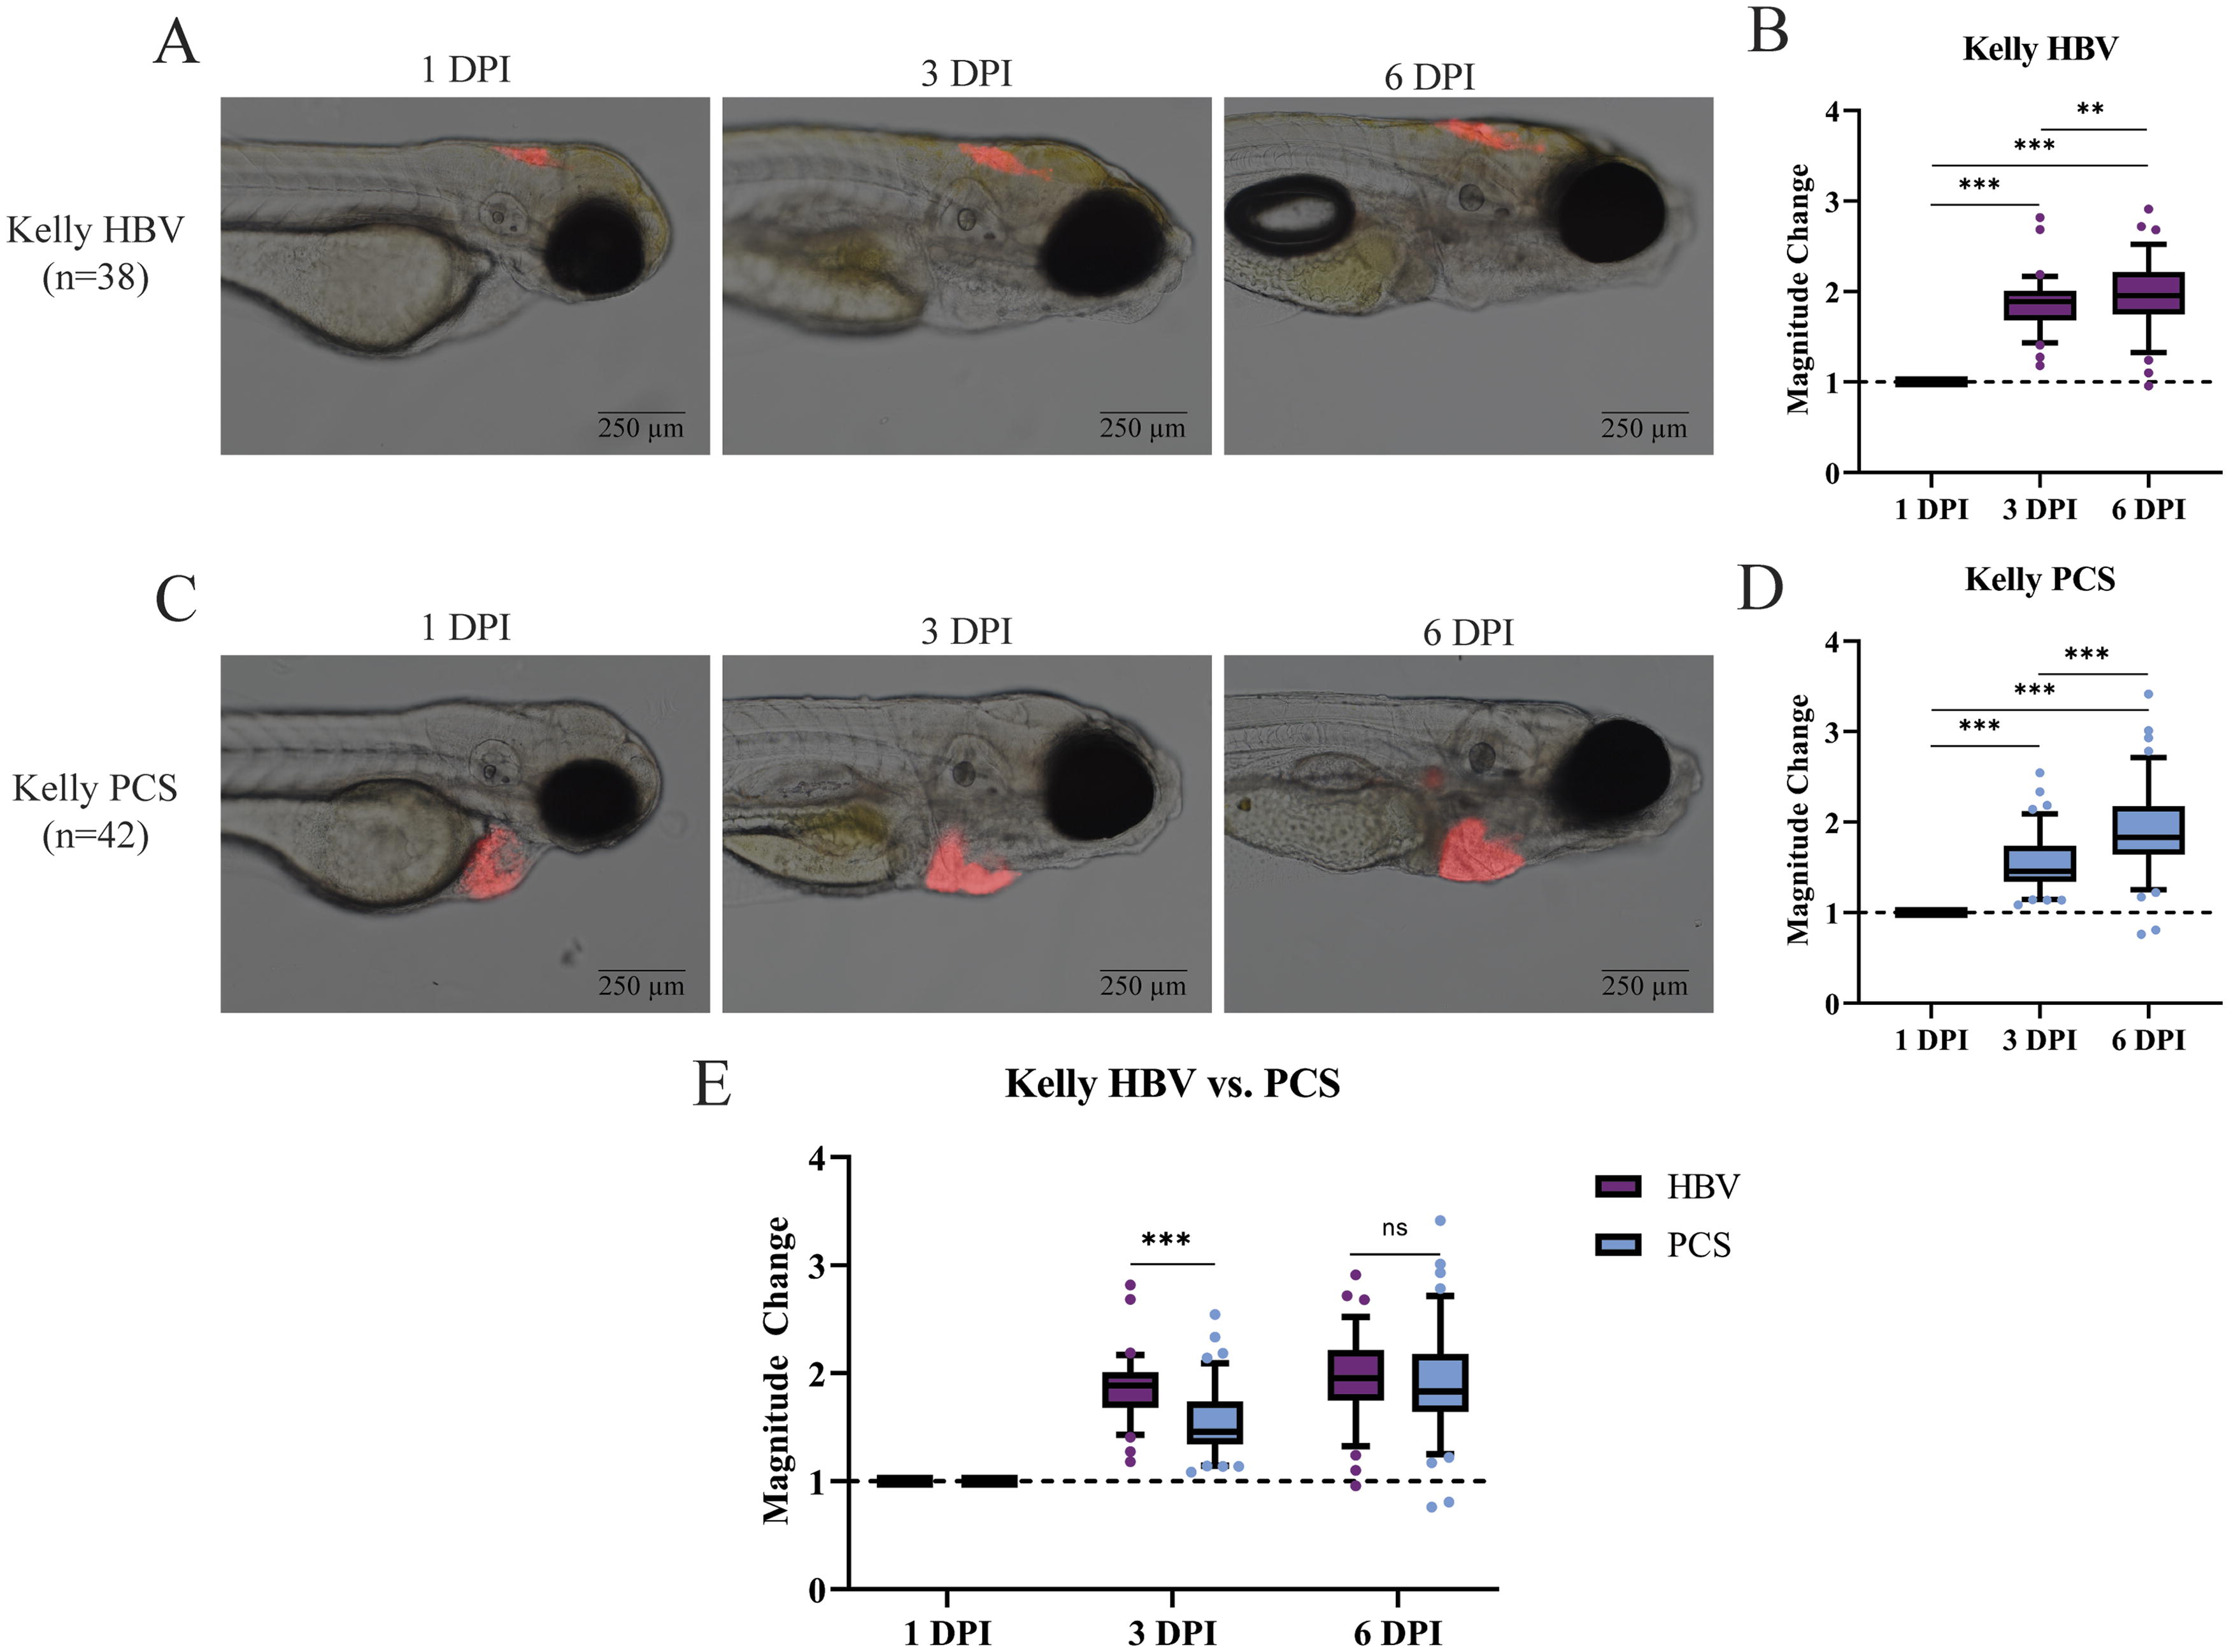
Fig. 1 Kelly cells successfully engraft in the HBV and PCS of 48 hpf zebrafish, with an initial location preference appreciated for the HBV. (A) Representative HBV xenografted fish imaged at 1, 3, and 6 DPI. (B) Quantification of tumor volume change depicted in (A); whiskers extending to 10th and 90th percentile. (C) Representative PCS xenografted fish imaged at 1, 3, and 6 DPI. (D) Quantification of tumor volume change depicted in (C); whiskers extending to 10th and 90th percentile. (E) Comparison of tumor growth between the HBV and PCS at 1, 3, and 6 DPI. Tumor volume calculated at each timepoint by multiplication of fluorescent area and mean intensity value at imaging. Magnitude of change at 3 and 6 DPI normalized to tumor volume at 1 DPI for individual fish. *p < 0.05, **p < 0.02, ***p < 0.01, ns not significant.
Image
Figure Caption
Acknowledgments
This image is the copyrighted work of the attributed author or publisher, and
ZFIN has permission only to display this image to its users.
Additional permissions should be obtained from the applicable author or publisher of the image.
Full text @ Zebrafish

