
Fig. 2
- ID
- ZDB-FIG-250121-20
- Publication
- Lawrence et al., 2024 - Diverse Engraftment Capability of Neuroblastoma Cell Lines in Zebrafish Larvae
- Other Figures
- All Figure Page
- Back to All Figure Page
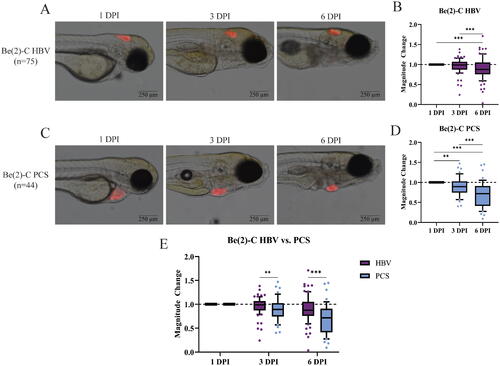
Be(2)-C cells fail to engraft in the HBV and PCS of 48 hpf zebrafish, with a location preference appreciated for the HBV. (A) Representative HBV xenografted fish imaged at 1, 3, and 6 DPI. (B) Quantification of tumor volume change depicted in (A); whiskers extending to 10th and 90th percentile. (C) Representative PCS xenografted fish imaged at 1, 3, and 6 DPI. (D) Quantification of tumor volume change depicted in (C); whiskers extending to 10th and 90th percentile. (E) Comparison of tumor growth between the HBV and PCS at 1, 3, and 6 DPI. Tumor volume calculated at each timepoint by multiplication of fluorescent area and mean intensity value at imaging. Magnitude of change at 3 and 6 DPI normalized to tumor volume at 1 DPI for individual fish. *p < 0.05, **p < 0.02, ***p < 0.01. |