
- Title
-
Simultaneous induction of systemic hyperglycaemia and stress impairs brain redox homeostasis in the adult zebrafish
- Authors
- Subba, R., Fasciolo, G., Geremia, E., Muscari Tomajoli, M.T., Petito, A., Carrella, S., Mondal, A.C., Napolitano, G., Venditti, P.
- Source
- Full text @ Arch. Biochem. Biophys.

Experimental design and timeline of the study. Fish were divided into the four experimental groups of control, Dextrose, CUMS, and CUMS + Dextrose. The Dextrose and CUMS groups were exposed to 111 mM dextrose solution and the CUMS procedure, respectively, for 14 days. At the end of the 14-day treatment, fasting blood glucose levels and body weights were measured, followed by whole brain sample extraction for downstream experiments. CUMS, chronic unpredictable mild stress. |

Effect of Dextrose, CUMS, and CUMS + Dextrose treatment on fasting blood glucose levels (a) and gained body weight (b). Data presented is the average of fifteen determinations obtained from fifteen different animals. ***, p < 0.001) ****, p < 0.0001). Each value is represented as mean ± SEM (n = 15). |

Effect of Dextrose, CUMS, and CUMS + Dextrose treatment on ROS content (a) and total antioxidant capacities (TAC) (b), GSH content (c), relative mRNA quantification of indicated gene: gclc (d). Nonparametric test was used for gclc mRNA content (panel d) statistical analysis. Data presented is the average of three determinations of different homogenates obtained from three-five pooled zebrafish brains. (*, p < 0.05; **, p < 0.01; ***, p < 0.001). Each value is represented as mean ± SEM (n = 3). |
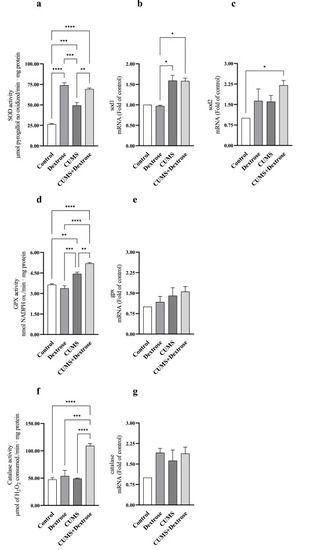
Effect of Dextrose, CUMS, and CUMS + Dextrose treatment on SOD activity (a), relative mRNA quantification of indicated genes: sod1 (b), and sod2 (c), GPX enzyme activity (d), relative mRNA quantification of indicated gene: gpx (e), catalase activity (f), and relative mRNA quantification of indicated gene: catalase (g). Nonparametric test was used for sod1, sod2, gpx, and catalse mRNA content (panels b, c, e and g, respectively) statistical analysis. Data presented is the average of three determinations of different homogenates obtained from three-five pooled zebrafish brains. (*, p < 0.05; **, p < 0.01; ***, p < 0.001) ****, p < 0.0001). Each value is represented as mean ± SEM (n = 3). |

Effect of Dextrose, CUMS, and CUMS + Dextrose treatment on total, cytosolic and nuclear NRF2 protein content. NRF2 representative western blots (a), total NRF2 relative protein content (b), cytosolic relative NRF2 protein content (c), nuclear relative NRF2 protein content and relative mRNA quantification of indicated genes: nrf2 (e), and keap1 (f). Nonparametric test was used for statistical analysis of mRNA content of nrf2 and keap1. Data presented is the average of three determinations of different homogenates obtained from three-five pooled zebrafish brains. (*, p < 0.05; **, p < 0.01; ***, p < 0.001) ****, p < 0.0001). Each value is represented as mean ± SEM. (n = 3). |

Effect of Dextrose, CUMS, and CUMS + Dextrose treatment on NRF2 immunoreactivity in the telencephalon of adult zebrafish. Representative images showing immunostaining of NRF2 (green) counterstained with DAPI (blue) (a) and estimated mean fluorescence intensity of NRF2 (depicted as fold of control) (b). The scale bar indicates 100 μm. Dm: medial zone of dorsal telencephalic area; Vd: dorsal nucleus of ventral telencephalic area. Nonparametric test was used for statistical analysis of all parameters analysed. Data presented is the average of three determinations of different homogenates obtained from three-five pooled zebrafish brains. (*, p < 0.05; **, p < 0.01; ***, p < 0.001) ****, p < 0.0001). Each value is represented as mean ± SEM. (n = 3). |

Effect of Dextrose, CUMS, and CUMS + Dextrose treatment on mitochondrial biogenesis: PGC1-α, NRF1, NRF2/GABP-α representative western blots (a), and relative protein content (b), and relative mRNA quantification of indicated genes: pgc1-α, nrf1, and nrf2/gabpb1 (c). Nonparametric test was used for pgc1-α, nrf1 and nrf2/gabpb1, mRNA content (panel c) statistical analysis. Data presented is the average of three determinations of different homogenates obtained from three -five pooled zebrafish brains. (*, p < 0.05; **, p < 0.01; ***, p < 0.001). Each value is represented as mean ± SEM. (n = 3). |

Effect of CUMS and Dextrose treatment on mitochondrial dynamics: DRP1 and MFN1 representative western blots (a), and relative protein content (b), and relative mRNA quantification of indicated genes: dnm1l/drp1, mfn1 (c). Nonparametric test was used for dmn1/drp1, and mfn1 mRNA content (panel c) statistical analysis. Data presented is the average of three determinations of different homogenates obtained from three pooled zebrafish brains. (*, p < 0.05; **, p < 0.01; ***, p < 0.001) ****, p < 0.0001). Each value is represented as mean ± SEM. (n = 3). |

|