
Fig. 4
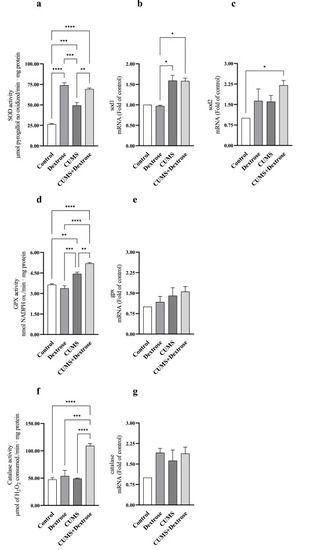
Effect of Dextrose, CUMS, and CUMS + Dextrose treatment on SOD activity (a), relative mRNA quantification of indicated genes: sod1 (b), and sod2 (c), GPX enzyme activity (d), relative mRNA quantification of indicated gene: gpx (e), catalase activity (f), and relative mRNA quantification of indicated gene: catalase (g). Nonparametric test was used for sod1, sod2, gpx, and catalse mRNA content (panels b, c, e and g, respectively) statistical analysis. Data presented is the average of three determinations of different homogenates obtained from three-five pooled zebrafish brains. (*, p < 0.05; **, p < 0.01; ***, p < 0.001) ****, p < 0.0001). Each value is represented as mean ± SEM (n = 3). |