
|
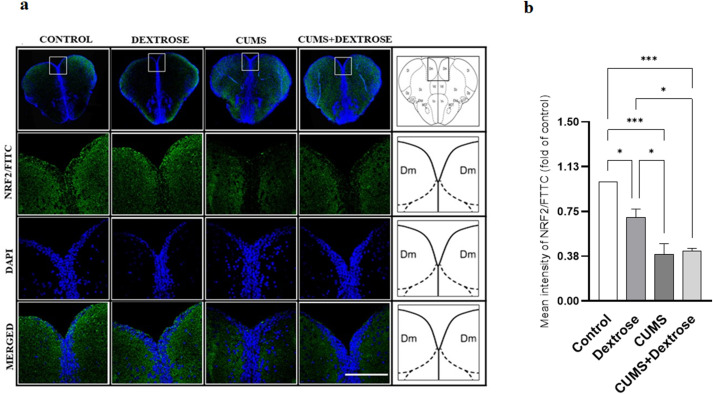
Fig. 6 Effect of Dextrose, CUMS, and CUMS + Dextrose treatment on NRF2 immunoreactivity in the telencephalon of adult zebrafish. Representative images showing immunostaining of NRF2 (green) counterstained with DAPI (blue) (a) and estimated mean fluorescence intensity of NRF2 (depicted as fold of control) (b). The scale bar indicates 100 μm. Dm: medial zone of dorsal telencephalic area; Vd: dorsal nucleus of ventral telencephalic area. Nonparametric test was used for statistical analysis of all parameters analysed. Data presented is the average of three determinations of different homogenates obtained from three-five pooled zebrafish brains. (*, p < 0.05; **, p < 0.01; ***, p < 0.001) ****, p < 0.0001). Each value is represented as mean ± SEM. (n = 3).