
- Title
-
Pediococcus pentosaceus PR-1 modulates high-fat-died-induced alterations in gut microbiota, inflammation, and lipid metabolism in zebrafish
- Authors
- Liu, Y., Zhu, D., Liu, J., Sun, X., Gao, F., Duan, H., Dong, L., Wang, X., Wu, C.
- Source
- Full text @ Front Nutr
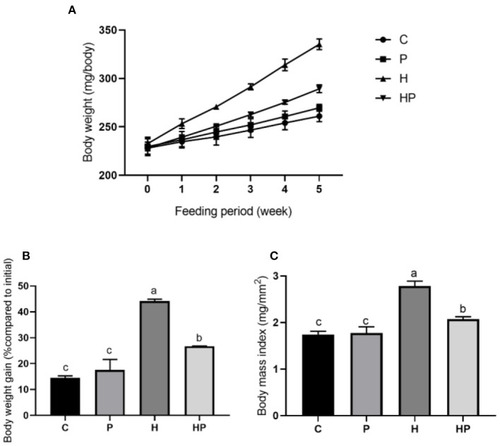
Changes in body weight and BMI in zebrafish on the different diets. (A, B) Changes in body weight during 5 weeks. (C) BMI in adult zebrafish after 5 weeks. |
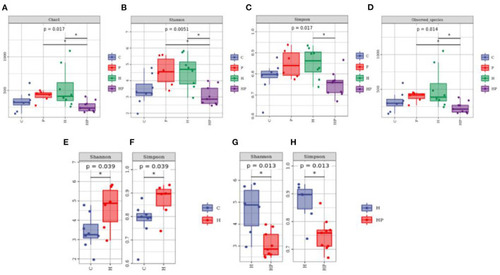
Boxplots of alpha diversity indices of gut microbiota community based on 16S rRNA sequencing. (A–D) Gut microbial alpha diversity of C, P, H and HP groups based on (A) Chao1, (B) Shannon, (C) Simpson, and (D) Observed species. All data are normalized to C group (100%) (*p < 0.05). (E, F) Gut microbial alpha diversity of C and H groups based on (E) Shannon, and (F) Simpson. All data are normalized to C group (100%) (*p < 0.05). (G, H) Gut microbial alpha diversity of H and HP groups based on (G) Shannon and (H) Simpson. All data are normalized to H group (100%) (*p < 0.05). |
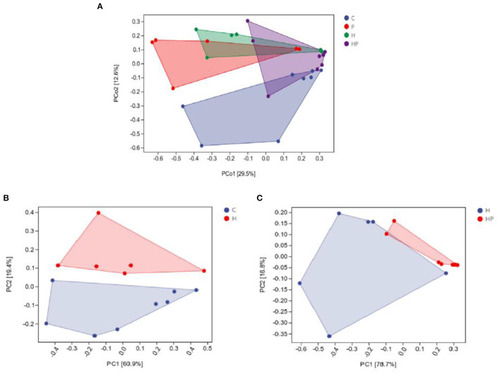
Principal coordinate analysis (Bray-Curtis dissimilarity) score plot of gut microbiota of the zebrafish fed on four different groups (A), on C and H group (B), and on H and HP group (C). |
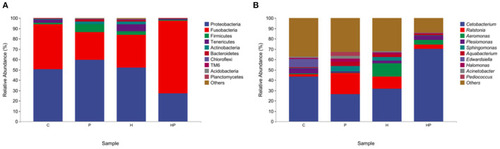
The gut microbiota of zebrafish in C, P, H, and HP groups. Relative abundance at phylum (A) and genus (B) level of the gut microbiota. |
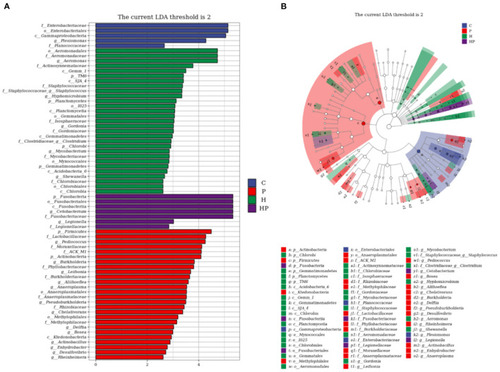
LEfSe analysis explored the discriminative microbiota in group C, P, H, and HP, respectively. (A) The LDA score histogram; (B) the cladogram. p < 0.05 was used as a threshold for LEfSe analysis. |
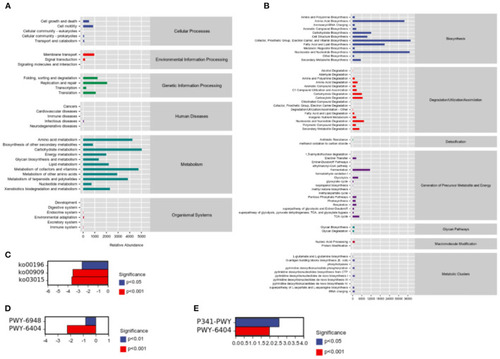
Sample functional abundances predicted by PICRUSt2 based on the abundance of labeled gene sequences in the samples. (A) KEGG databases. (B) Metacyc databases. (C) Significant pathway analysis between H and HP groups based on KEGG databases. (D) Significant pathway analysis between C and H groups based on Metacyc databases. (E) Significant pathway analysis between H and HP groups based on Metacyc databases. |
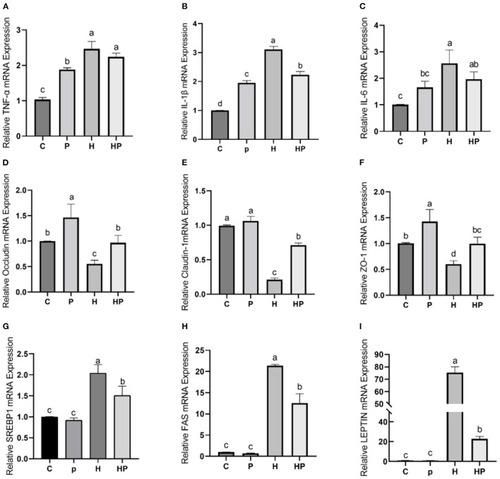
Effect of P. pentosaceus PR-1 on intestinal inflammation, gut permeability, and lipid metabolism in HFD-fed zebrafish. (A–C) The total RNA was extracted from the intestine, and the relative mRNA expression levels of TNF-α (A), IL-1ß (B), and IL-6 (C) were determined by qRT-PCR. (D–F) The total RNA was extracted from the intestine, and the relative mRNA expression levels of Occludin (D), Claudin-1 (E), and ZO-1 (F) were determined by qRT-PCR. (G, H) The total RNA was extracted from the liver, and the relative mRNA expression levels of SREBP1 (G), FAS (H), and LEPTIN (I) were determined by qRT-PCR. Values were represented as the mean ± S.D. (n = 6). Values with different superscript letters are significantly different (p < 0.05). |
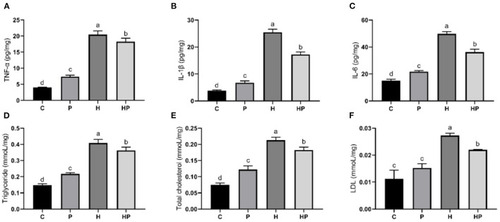
Effect of P. pentosaceus PR-1 on liver pro-inflammatory cytokines (A–C) and biochemical parameters (D–F) in HFD-fed zebrafish. (A) Hepatic concentration of tumor necrosis factor α (TNF-α). (B) Hepatic concentration of interleukin-1ß (IL-1ß). (C) Hepatic concentration of interleukin-6 (IL-6). (D) Hepatic level of triglyceride. (E) Hepatic level of total cholesterol. (F) Hepatic level of low-density lipoprotein (LDL). Values were represented as the mean ± S.D. (n = 3). Values with different superscript letters are significantly different (p < 0.05). |
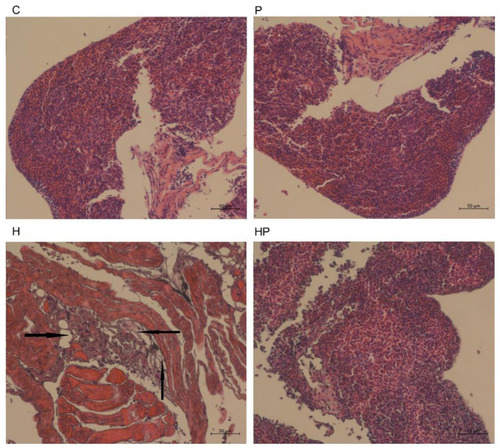
Histological changes of liver sections measured by H&E staining (scale bar is 50 μm). The black arrows indicate extensive hydropic degeneration of hepatocytes characterized by swollen, pale, vacuolated cytoplasm. |