
Image
|
Figure Caption
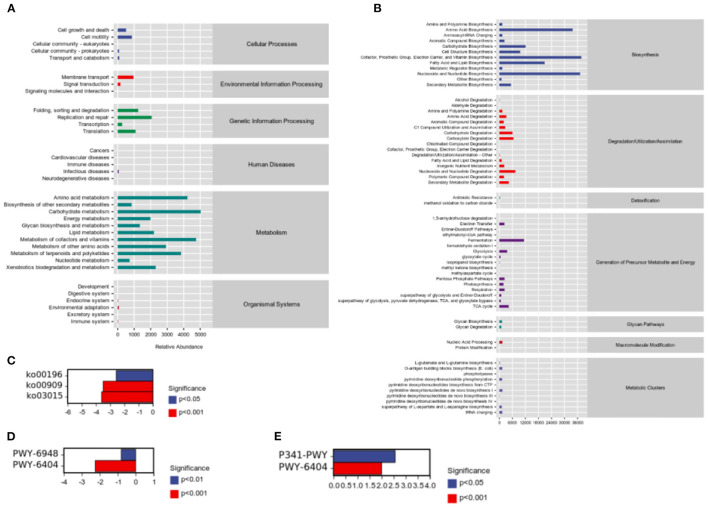
Figure 6
Sample functional abundances predicted by PICRUSt2 based on the abundance of labeled gene sequences in the samples. (A) KEGG databases. (B) Metacyc databases. (C) Significant pathway analysis between H and HP groups based on KEGG databases. (D) Significant pathway analysis between C and H groups based on Metacyc databases. (E) Significant pathway analysis between H and HP groups based on Metacyc databases.
Acknowledgments
This image is the copyrighted work of the attributed author or publisher, and
ZFIN has permission only to display this image to its users.
Additional permissions should be obtained from the applicable author or publisher of the image.
Full text @ Front Nutr