
Image
|
Figure Caption
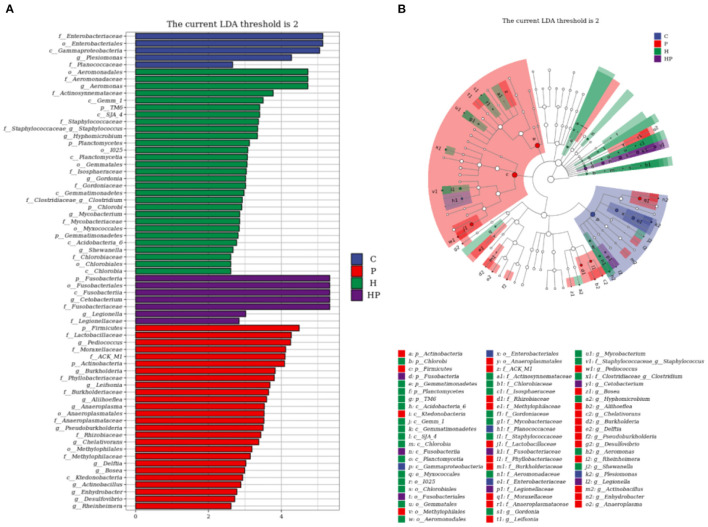
Figure 5
LEfSe analysis explored the discriminative microbiota in group C, P, H, and HP, respectively. (A) The LDA score histogram; (B) the cladogram. p < 0.05 was used as a threshold for LEfSe analysis.
Acknowledgments
This image is the copyrighted work of the attributed author or publisher, and
ZFIN has permission only to display this image to its users.
Additional permissions should be obtained from the applicable author or publisher of the image.
Full text @ Front Nutr